Log-ratio (bound/input)
Figure S4: Flowchart summarising microarray analysis. Microarray feature extraction (n= 223,359). Log-ratio (bound/input). Methylation estimation (BATMAN). Quantile normalization. Modified t-statistic ( limma ). Probe variability. 500 Kb window enrichment. 1000bp window enrichment.

Log-ratio (bound/input)
E N D
Presentation Transcript
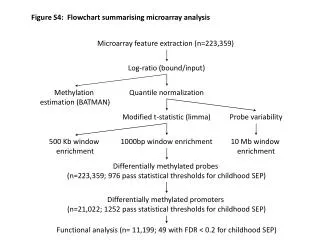
Figure S4: Flowchart summarising microarray analysis Microarray feature extraction (n=223,359) Log-ratio (bound/input) Methylation estimation (BATMAN) Quantile normalization Modified t-statistic (limma) Probe variability 500 Kb window enrichment 1000bp window enrichment 10 Mb window enrichment Differentially methylated probes (n=223,359; 976 pass statistical thresholds for childhood SEP) Differentially methylated promoters (n=21,022; 1252 pass statistical thresholds for childhood SEP) Functional analysis (n= 11,199; 49 with FDR < 0.2 for childhood SEP)