Download
1 / 30
300 likes | 385 Views
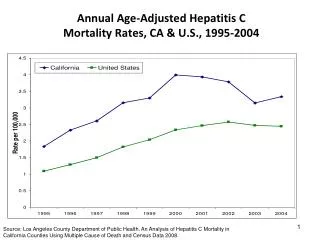
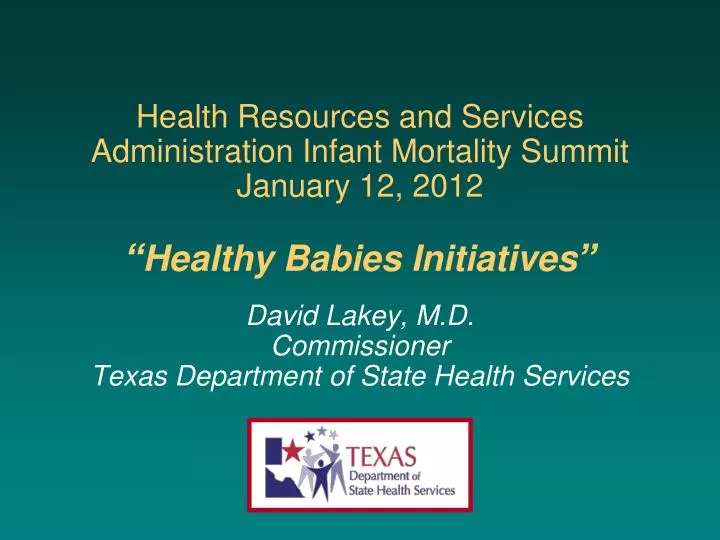
Health Resources and Services Administration Infant Mortality Summit January 12, 2012 “ Healthy Babies Initiatives ” David Lakey, M.D. Commissioner Texas Department of State Health Services. Infant Mortality Rates by Race (Texas, 1995 - 2008 ). 2. Preterm Births by Race (Texas, 2000 – 2008).

E N D
Health Resources and Services Administration Infant Mortality Summit January 12, 2012“Healthy Babies Initiatives”David Lakey, M.D.CommissionerTexas Department of State Health Services
Infant Mortality 2008 Preterm Births 2008
Medicaid Costs • >55% of all Texas births (225,000) paid by Medicaid • $2.2 billion per year in birth and delivery-related services for moms and infants through first year • ~70% of Medicaid costs for hospitalized newborns tied to billing codes for prematurity • Infant care costs growing by ~10% per year • 50% are attributable to extremely preterm infants • Newborn costs (1st year) • Extreme Preterm infant: $63,124 • Term infant: $404 7
Medicaid Expenditures - Births Millions of Dollars
Poor Health of Newborn Infants Drives Hospital/Healthcare Costs 9
Costs Associated with Preterm Births • In 2005, the U.S. economic burden of preterm births was $26.2 billion, or $51,600 per preterm infant. Costs per infant: • Medical care services: $33,200 • Lost household & labor productivity: $11,200 • Maternal deliver costs: $3,800 • Special education: $3,200 • Early intervention services: $1,200 10 Info Source: Institute of Medicine of the Academies, 2007
Texas Medicaid Claims Data by Diagnosis Related Group 11 Note: Texas population is ~23 million
Maternal Health/ Prematurity Newborn Care Maternal Care Infant Health Possible Points for Intervention Preconception Health Health Behaviors Perinatal Care Prenatal Care High Risk Referral Obstetric Care Perinatal Management Neonatal Care Pediatric Surgery Safe Sleep Breast Feeding Injury Prevention 12
What is Healthy Texas Babies? • Healthy Texas Babies (HTB) is an initiative to decrease infant mortality • Goals of Healthy Texas Babies Initiative: • Provide local partnerships and coalitions with major roles in shaping programs in their communities • Use evidence-based interventions • Decrease preterm birth rate by 8% over 2 years • Save ~ $7.2 million in Medicaid costs over 2 years
Healthy Texas Babies Expert Panel Spring 2011 • Three workgroups convened: • Community • Providers • Payers • Each workgroup developed two deliverable that included: • Measurable, evidence-based intervention • Literature review • Plan for scalability and sustainability Summer 2011 • Deliverables presented to entire Expert Panel • Proposed deliverables were approved • Expert Panel will continue to meet every six months • Agreed to be available for consultation to DSHS on issues pertaining to perinatal outcomes
Inductions and Cesarean Sections • They are common • 1 in 4 deliveries are induced in Texas • 1 in 3 women in Texas gave birth by C-section • They are increasing • Induction rates increased by 38% in Texas between 2000-2008 • C-section rates increased by 37% in Texas between 2000-2008 • They occur before 39 weeks • In 2008, 38% of single-birth inductions were performed before 39 weeks of gestation • ~74% of all single-birth C-sections were performed without attempting labor. More than half of these C-sections were performed before 39 weeks of gestation 17
Preventing Infant Mortality through Regionalization of Perinatal Services • Very low birth weight (VLBW) infants represent less than 2% of US births, but account for 55% of infant deaths • Levels of perinatal care (I, II, & III) • Level III facilities have the ability to care for very low birth weight and very preterm (VPT) infants. • VLBW and VPT infants not born in a level III hospital are more likely to die. • HP 2010 goal: 90% of all VLBW infants are born in level III hospitals • Has only been met by 5 states • 10 states (including TX) are below 70% • Less than 50% of VLBW births in Texas occur in level III facilities (49% based on 2005 & 2006 birth certificate data) 18
Healthy Texas Babies: 82nd Legislative Session • Legislature passed three related perinatal health bills: • HB 1983 – Eliminates Medicaid payment for elective inductions and c-sections before the 39th week • HB 824 – Creates an outreach campaign to promote fathers' involvement with their children before birth • HB 2636 – Creates a council to study neonatal intensive care unit regionalization • Legislature appropriated $4.1 million in General Revenue funds to DSHS funding the Healthy Texas Babies initiative
National Perspective • DHHS – HRSA • Region 4 & 6 Infant Mortality Summit • Big 5 – March of Dimes • AMCHP Action Learning Collaborative • HHS Secretary’s Advisory Committee on Infant Mortality • Region 4 and 6 State Health Officers Learning Collaborative • ASTHO Presidential Challenge
Borrowing Best Practices from Other States • Kentucky - March of Dimes Healthy Babies Are Worth the Wait™ • California Perinatal Quality Care Collaborative & Maternal Quality Care Collaborative • Hospital Quality Improvement Projects: Seton Family of Hospitals • Ohio Perinatal Quality Collaborative
ASTHO Current Activities • Current Committees • Steering Committee • Data and Best Practices/Policy Committees • Communication and Marketing Committee • Strong Collaboration • HRSA, AMCHP, March of Dimes, Leap Frog, National Association of Medicaid Directors, AHA, Secretaries Advisory Committee on Infant Mortality, CDC, CMS
ASTHO 2011 Presidential Challenge Improve birth outcomes by reducing infant mortality and prematurity in the United States Objectives: • Focus on improving birth outcomes as SHOs and state leadership teams work with state partners on health and community system changes • Create a unified message that builds on the best practices from around the nation • Develop clear measurements to evaluate targeted outreach, progress, and return on investment
S.M.A.R.T. Challenge • Reduce preterm births by 8% by 2014 (based on 2009 level)
One Roadmap to Reducing Prematurity by 8% by 2014 • Reduce non-medically indicated elective inductions and cesarean sections prior to 39 weeks gestation. • Reduction of 25,000 PTB • Ensure universal access to 17P for eligible women. • Reduction of 10,000 PTB • Eliminate the incidence of higher order multiples due to assistive reproductive technologies, 97 percent of whom are born preterm • Reduction of 2,300 PTB • Reduce rates of smoking among pregnant women by 10 percent. • Reduction of 1,300 PTB
ASTHO Website • ASTHO website with matrix of current emerging, promising and best practices will be available soon – Facilitating use of a menu of strategies for varying levels of intervention linked to concrete implementation steps and detailed resource information • Other resources will include case studies and commentary from state leaders • Guide, create or strengthen state partnerships and fine-tune current programs • The ASTHO site will also link to tool kits on best practices created by AMCHP and March of Dimes
Conclusion • Rates of prematurity and infant mortality are much higher then they should be • The cost of prematurity is very high, measured in both human and economic costs • There are proven methods states can use to combat these public health issues • We will not be successful unless we work together
Estimated Medicaid Cost-Savings (Assuming 8% Decrease in Preterm over 2 Years) $7.2 million: Estimated potential cost-savings to Texas Medicaid over 2 years, based on 2 prematurity categories: Prematurity with Major Problems (DRG code 387) Prematurity without Major Problems (DRG code 388) Prematurity with Major Problems: Estimated 3,332 claims, or 8% = reduction of 267 claims $19,059 per claim = $5,088,753 Prematurity without Major Problems: Estimated 6,461 claims, or 8% = reduction of 517 claims; $4,019 per claim = $2,077,823; Total = $7.2 million 30 30 Note: Texas population is ~23 million