Download

1 / 54
540 likes | 596 Views
Learn about sensitivity, specificity, predictive values, Bayes’ theorem, screening programs, misclassification impact, and clinical research studies. Understand how diagnostic tests are used as key elements in clinical medicine and public health.

E N D
Lecture 6Diagnostic Tests and Screening Kevin Schwartzman MD June 16, 2006
Objectives Students will be able to: 1. Define and calculate the following: Sensitivity, specificity, positive and negative predictive values of diagnostic tests • Illustrate the influence of prevalence and/or pre-test probability on predictive values • Define pre- and post-test probabilities in terms of Bayes’ theorem and likelihood ratios 4. Identify key elements of screening programs and evaluations of their impact 5. Describe the impact of misclassification on results of clinical research studies
Diagnostic Tests and Screening Readings: • Fletcher, chapters 3 (Diagnosis), 9 (Prevention) • Barry MJ, Prostate-specific antigen testing for early diagnosis of prostate cancer, N Engl J Med 2001; 344:1373-1377 [Clinical Practice]
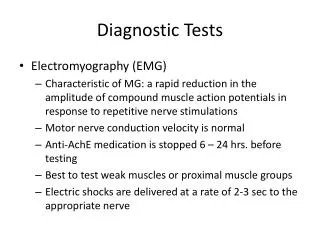
Diagnostic Tests Tests as diagnostic aids and screening tools - key element of clinical medicine and public health. • Electrocardiogram, cardiac enzymes for diagnosis of myocardial infarction • Murphy’s sign (right upper abdominal tenderness on inspiration) in diagnosis of acute cholecystitis • Pap smear for detection of cervical cancer Also essential in many epidemiologic studies where diagnostic criteria and/or tests are used to establish exposure, outcome status. Goal is to minimize misclassification; yet some misclassification may be inevitable for logistical reasons
Diagnostic Tests and Screening—Slide 2 Definitive diagnosis/classification may be difficult or impossible to obtain. “Gold standard” may be expensive, inappropriate (e.g. autopsy based) or unsuitable (e.g. clinical follow-up when immediate decision required). Tests may serve as surrogates but this requires that they be appropriately validated against a suitable gold standard - and that their properties be documented.
Diagnostic Tests and Screening--Slide 3 We will focus largely on the situation where the diagnosis/outcome and the test result are both dichotomous, i.e. Disease: Present vs. absent Test: Positive vs. negative We need to know how well the test separates those who have the disease of interest from those who do not.
Diagnostic Tests and Screening-- Slide 4 We can use a 2x2 table to describe the various possibilities: Disease + Disease - Test + True + False + Test - False - True - True positive rate = P(T+ D+) = TP/(TP+FN) = Sensitivity: The probability that a diseased individual will be identified as such by the test
Diagnostic Tests and Screening-- Slide 5 Disease +Disease - Test + True + False + Test - False - True - True negative rate = P(T- D-) = TN/(TN+FP) = Specificity: The probability that an individual without the disease will be identified as such by the test
Diagnostic Tests and Screening-- Slide 6 Complementary probabilities: False negative rate = FN/(TP+FN) = P(T- D+) = 1-sensitivity False positive rate = FP/(TN+FP) = P(T+ D-) = 1-specificity
Diagnostic Tests and Screening-- Slide 7 Example: A researcher develops a new saliva pregnancy test. She collects samples from 100 women known to be pregnant by blood test (the gold standard) and 100 women known not be pregnant, also based on the same blood test. The saliva test is “positive” in 95 of the pregnant women. It is also “positive” in 15 of the non-pregnant women. What are the sensitivity and specificity?
Diagnostic Tests and Screening-- Slide 8 Pregnant Non-pregnant Totals Saliva + 95 15 110 Saliva - 5 85 90 Totals 100 100 200 Sensitivity = TP/(TP+FN) = 95/100 = 95% Specificity = TN/(TN+FP) = 85/100 = 85%
Diagnostic Tests and Screening-- Slide 9 Is it more important that a test be sensitive or specific? • It depends on its purpose. A cheap mass screening test should be sensitive (few cases missed). A test designed to confirm the presence of disease should be specific (few cases wrongly diagnosed). • Note that sensitivity and specificity are two distinct properties. Where classification is based on an cutpoint along a continuum, there is a tradeoff between the two.
Diagnostic Tests and Screening-- Slide 10 Example: The saliva pregnancy test detects progesterone. A refined version is developed. Suppose you add a drop of indicator solution to the saliva sample. It can stay clear (0 reaction) or turn green (1+), red (2+), or black (3+). (For purposes of discussion we will ignore overlapping colors)
Diagnostic Tests and Screening-- Slide 11 The researcher conducts a validation study and finds the following: PregnantNon-pregnantTotals Saliva 3+ 85 5 90 Saliva 2+ 10 10 20 Saliva 1+ 3 17 20 Saliva 0 2 68 70 Totals 100 100 200
Diagnostic Tests and Screening-- Slide 12 The sensitivity and specificity of the saliva test will depend on the definition of “positive” and “negative” used. • If “positive” 1+, sensitivity = (85+10+3)/100 = 98% specificity = 68/100 = 68% • If “positive” 2+, sensitivity = (85+16)/100 = 95% specificity = (68+17)/100 = 85% • If “positive” = 3+, sensitivity = 85/100 = 85% specificity = (68+17+10)/100 = 95%
Diagnostic Tests and Screening-- Slide 13 The choice of cutpoint depends on the relative adverse consequences of false-negatives vs. false-positives. If it is most important not to miss anyone, use sensitivity and specificity. If it is most important that people not be erroneously labeled as having the condition, use sensitivity and specificity. A receiver operating characteristic (ROC) curve is often used to illustrate the use of different cutpoints for a test with continuous values.
Diagnostic Tests and Screening-- Slide 14 In practice, the clinician or researcher needs to know how to interpret test results without the simultaneous gold standard measurement. (If you already know the “gold standard” result, why would you obtain the other test?)
Diagnostic Tests and Screening – Slide 15 Hence we need to know: 1. How likely is a patient to have the condition of interest, given a “positive” test result? This is P(D+ T+), or the positive predictive value of the test [=TP/(TP+FP)] 2. How likely is a patient not to have the condition of interest, given a “negative” test result? This is P(D- T-), or the negative predictive value of the test [=TN/(TN+FN)]
Diagnostic Tests and Screening-- Slide 16 Key point: The positive and negative predictive values depend on the pretest probability of the condition of interest - in addition to the sensitivity and specificity of the test. This pretest probability is often the prevalence of the condition in the population of interest. But it can also reflect restriction of this population based on clinical features and/or other test results. For example, the pretest probability of pregnancy will be very different among young women using oral contraceptives from that among sexually active young women using no form of contraception.
Diagnostic Tests and Screening-- Slide 17 Example: The saliva pregnancy test is administered 30 days after the first day of the last menstrual period to two groups of women who have thus far “missed” a period. Group 1: 1000 sexually active young women using no contraception. Pretest probability of pregnancy 40% (hypothetical)
Diagnostic Tests and Screening-- Slide 18 Based on sensitivity of 95%, expected TP = 400 x 0.95 = 380 expected FN = 400-380 = 20 Based on specificity of 85%, expected TN = 600 x 0.85 = 510 expected FP = 600-510 = 90 Pregnant Non-pregnant Totals Test + 380 90 470 Test - 20 510 530 Totals 400 600 1000
Diagnostic Tests and Screening-- Slide 19 Positive predictive value = TP = 380/470 = 81% TP+FP In this context, a woman with a positive saliva test has an 81% chance of being pregnant. Negative predictive value = TN = 510/530 = 96% TN+FN In this context, a woman with a negative saliva test has a 96% chance of not being pregnant (and a 4% chance of being pregnant)
Diagnostic Tests and Screening-- Slide 20 Group 2: 1000 oral contraceptive users - pretest probability of pregnancy = 10% (hypothetical) Pregnant Non-pregnant Totals Test + 95 135 230 Test - 5 765 770 Totals 100 900 1000 Using sensitivity = 95%, expected TP = 0.95 x 100 = 95 expected FN = 100-95 = 5 Using specificity = 85%, expected TN = 0.85 x 900 = 765 expected FP = 900-765 = 135
Diagnostic Tests and Screening-- Slide 21 In this context, positive predictive value is only 95/230 = 41% [TP/(TP+FP)] Negative predictive value is [TN/(TN+FN)] = 765/770 = 99%
Diagnostic Tests and Screening-- Slide 22 In which situation is the saliva test more helpful? Group 1: Test +: 81% probability of pregnancy Pretest probability 40% Test -: 4% probability of pregnancy Group 2: Test +: 41% probability Pretest probability 10% Test -: 1% probability
Diagnostic Tests and Screening-- Slide 23 • Note that the same test would likely be used and interpreted very differently in these two contexts. • This does not imply any difference in the characteristics of the test itself, i.e. sensitivity and specificity are not altered by the pretest probability of the condition of interest. • Tests are most useful when the pretest probability is in a middle range. They are unlikely to be useful when the pretest probability is already very high or low.
Diagnostic Tests and Screening-- Slide 24 Deriving predictive values (post-test probabilities) using a 2x2 table: 1. Fill in totals with/without disease based on pretest probabilities. In general these depend on external information about the population of interest and cannot be extrapolated from a validation study. 2. Fill in the positives and false negatives using sensitivity. - TP = Number with disease x sensitivity - FN = Number with disease x (1-sensitivity) 3. Fill in true negatives and false positives using specificity. - TN = Number free of disease x specificity - FP = Number free of disease x (1-specificity) 4. Calculate PPV = TP/(TP+FP) Calculate NPV = TN/(TN+FN)
Diagnostic Tests and Screening-- Slide 25 Bayes’ theorem: Allows us to calculate revised (“posterior” or post-test) probabilities, based on “prior” (pretest) probabilities and new information (here, test results). General form: P(B A) = P(A B) x P(B) P[(A B) x P(B)] + [P(A B) x P(B)] Note that B corresponds to “Not B”, so P(B) = 1 - P(B)
Diagnostic Tests and Screening-- Slide 26 For positive predictive value, P (D+ T+) = P (T+ D+) x P(D+) [P(T+ D+) x P(D+)] + [P(T+ D-) x P(D-)] Note this is identical to TP TP+FP
Diagnostic Tests and Screening - Slide 27 For negative predictive value, P(D- T-) = P(T- D-) x P(D-) [P(T- D-) x P(D-)]+[P(T- D+)xP(D+)] which is equal to TN TN+FN
Diagnostic Tests and Screening-- Slide 28 Example: What would be the positive and negative predictive values for the saliva pregnancy test if the pretest probability of pregnancy is 20%? (sensitivity = 95%, specificity = 85%) P(pregnant T+) = P(T+ pregnant) x P(pregnant) [P(T+ pregnant)xP(pregnant)]+[P(T+ not pregnant)xP(not pregnant)] = 0.95 x 0.2 = 0.19 = 0.61 or 61% (0.95x0.2)+(0.15x0.8) 0.19+0.12
Diagnostic Tests and Screening - Slide 29 P(not pregnant T-) = P(T- not pregnant)xP(not pregnant) [P(T- not pregnant)xP(not pregnant)]+ [P(T- pregnant)xP(pregnant)] = 0.85 x 0.8 = 0.68 = 0.99 or 99% (0.85x0.8)+(0.05x0.2) 0.68+0.01
Diagnostic Tests and Screening - Slide 30Likelihood Ratios • An alternative way of developing post-test probabilities (predictive values) • Relationship between pre- and post-test odds, where • Odds = [probability of x]/[1-probability of x] • If pre-test probability of pregnancy is 20%, then odds of pregnancy = 0.2/(1-0.2) = 0.25 • Odds of no pregnancy = 0.8/(1-0.8) = 4 [the reciprocal] • Probability = [odds of x]/[1+odds of x] • If prior odds of pregnancy = 0.25, then pre-test probability of pregnancy = 0.25/(1+0.25) = 0.2
Diagnostic Tests and Screening - Slide 31Likelihood Ratios • Post-test odds = pre-test odds x likelihood ratio, where • Likelihood ratio = [P test result│condition of interest] [P test result│no condition of interest]
Diagnostic Tests and Screening - Slide 32Likelihood Ratios • Pregnancy example, saliva test as before • Prior odds 0.25 (20% pre-test probability) • Sensitivity 95%, specificity 85% • Post-test odds with positive test = 0.25 x (0.95/0.15) = 0.25 x 6.33 = 1.58 • Post-test probability = 1.58/(1+1.58) = 61% • This approach can be particularly useful for tests with multiple categories, and for serial testing
Diagnostic Tests and Screening-- Slide 33 Pitfalls in assessments of diagnostic test performance • Importance of pretest probability, as discussed. • Pretest probability (and predictive values) cannot ordinarily be extrapolated from a validation study, since the proportions with and without disease are determined by the investigator • unless there is truly random sampling that reflects the context in which the test will be applied.
Diagnostic Tests and Screening - Slide 34 Was the test applied in a consistent fashion to all members of the validation sample? e.g. was test interpretation properly blinded? (unrelated to “true” presence or absence of disease or clues to it) Was the gold standard applied in a consistent fashion to all members of the validation sample? (again, blinded application not related to results of test(s) being evaluated)
Diagnostic Tests and Screening-- Slide 35 Example: New diagnostic tests for pulmonary embolism “Positive” results confirmed by pulmonary angiography (an invasive test with some risk) “Negative” results confirmed by clinical follow-up, i.e. does the patient return with further symptoms or signs? - this condition can resolve spontaneously and not recur
Diagnostic Tests and Screening-- Slide 36 Result: Good documentation of true and false positives Overestimate true negatives, underestimate false negatives • sensitivity of test overestimated specificity of test also overestimated
Diagnostic Tests and Screening-- Slide 37 Importance of the sample used for test validation: • What was the spectrum of the condition evaluated? • How similar is this to the situation in which the test will be used?
Diagnostic Tests and Screening-- Slide 38 Example: saliva pregnancy test Imagine that test hinges on ability to detect progesterone, a hormone where the level increases as pregnancy progresses • If the test is validated by comparing women who are 3 months pregnant with young, non-pregnant women, it will perform very well as progesterone levels are very high by 3 months.
Diagnostic Tests and Screening - Slide 39 • On the other hand, the sensitivity may be much lower if the pregnant group consists of women who are only 1 month after their last menstrual period. • Conversely, the estimated specificity of the test will be higher if the comparison group has very low progesterone levels (e.g. postmenopausal women).
Diagnostic Tests and Screening-- Slide 40 You would reject results of a validation study involving women who are 3 months pregnant, or women who are postmenopausal • By 3 months, pregnancy is usually relatively obvious by history and thus is unlikely to be the situation where the test will be used. • The test would never be administered to post-menopausal women!
Diagnostic Tests and Screening-- Slide 41 So: Sensitivity and specificity estimates do not depend on the prevalence of the condition in question. BUT their values and their validity depend on the context in which they were obtained, vis-a-vis the context in which they will be used. This in turn will affect positive and negative predictive values, quite apart from the prevalence/prior probability of the condition.
Diagnostic Tests and Screening - Slide 42 Misclassification The use of an imperfect diagnostic test leads to misclassification (assigning individuals to the wrong category). In research studies, it is most often non-differential. • That is, the probability of misclassification is not associated with the exposure or intervention under study.
Diagnostic Tests and Screening - Slide 43 • For example, the use of an imperfect cardiac enzyme assay to define myocardial infarction in a primary prevention study with a novel anti-platelet agent. • Another example: ascertaining the development of HIV infection based on a saliva test, comparing injection drug users who do vs. who do not clean their needles (in a cohort study).
Diagnostic Tests and Screening-- Slide 44 • The effect of nondifferential misclassification is to dilute any association which may be present, i.e. the effect measure is biased toward the null value. • Consider the extreme case where the cardiac enzyme assay is no better than flipping a coin. Then no effect of the antiplatelet drug will be detected, even if it is truly very beneficial. • If the degree of misclassification is known, then corrected 2x2 tables and parameter estimates can be derived.
Diagnostic Tests and Screening-- Slide 45 Differential misclassification implies that measurement error is associated with study group membership, i.e. it operates differentially between groups. Imagine that the antiplatelet drug directly interferes with the cardiac enzyme assay, leading to underestimation of enzyme levels. Here, the drug may appear to be protective even if in reality, it is no better than placebo. Hence depending on the specific circumstances, differential misclassification may lead to under- or overestimation of the true association between exposure and outcome.
Diagnostic Tests and Screening – Slide 46Screening • “The identification of an unrecognized disease or risk factor by…[a] procedure that can be applied reasonably rapidly to asymptomatic people.” (Fletcher, p. 149) • Screening is relevant only if disease is relatively common, testing is sensitive, specific, and cost-effective, and early treatment improves outcomes
Diagnostic Tests and Screening – Slide 47 Sensitivity may be calculated by • Detection method: Cases found by screening Cases found by screening + those identified during followup of screened persons (interval cases) • Incidence method: Incidence among unscreened - interval incidence among screened Incidence among unscreened Incidence method accounts for “overdiagnosis” of abnormalities that are not clinically important, e.g. prostate cancer