Download
1 / 34
370 likes | 561 Views
Radiation-Induced Trap Spectroscopy in Si Bipolar Transistors and GaAs Diodes. 22 nd RD50 Workshop University of New Mexico June 3-5, 2013 Robert Fleming Sandia National Labs. Outline. Introduction Research Objectives DLTS & transistor fundamentals Silicon

E N D
Radiation-Induced Trap Spectroscopy in Si Bipolar Transistors and GaAs Diodes 22nd RD50 Workshop University of New Mexico June 3-5, 2013 Robert Fleming Sandia National Labs Sandia National Laboratories is a multi-program laboratory operated by Sandia Corporation, a wholly owned subsidiary of Lockheed Martin company, for the U.S. Department of Energy’s National Nuclear Security Administration under contract DE-AC04-94AL85000.
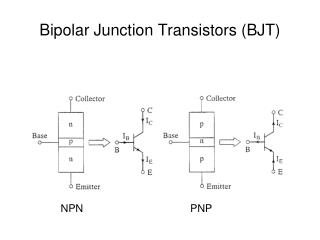
Outline • Introduction • Research Objectives • DLTS & transistor fundamentals • Silicon • BJT collector – the silicon divacancy & its relatives • BJT base – the vacancy-donor (VP) • Correlating defects and BJT gain • GaAs • Phonon assisted tunneling – electric field enhanced emission
Research Objectives • Predict performance of bipolar transistors after exposure to neutrons • Data from ion damaged devices • Avoid hazards of fast-burst neutron reactors • Models of defect evolution are used to connect ion data with neutron predictions [models are not presented in this presentation, see Myers, et al., J. Appl. Phys. 104, 044507 (2008)] • Experimental Objectives • Understand effects of defect clustering (DLTS & transistor gain) • Correlate gain degradation of BJT’s with specific defects (Si) • Understand effects of phonon-assisted tunneling (GaAs)
Emission Rate # of traps DLTS: Deep Level Transient Spectroscopy Filling pulse: carrier capture Transient: carrier emission Rate = 232 s-1 DLTS peaks occur when defect emission rate is equal to the rate window Deep (near midgap) Shallow (near Ec) On the DLTS plots presented in this talk, the maximum temperature correspond to emission from ~ Eg/2
Location of Generation-Recombination IC IE IB Gain = Ic/ Ib Recombination at high current in b/e depletion + neutral base Recombination at low current in b/e depletion region Fleming, HEART. 4/2/2009, Slide 5
DLTS Locations b/e junction b/c junction Recombination at high current in b/e depletion + neutral base Recombination at low current in b/e depletion region
Silicon Bipolar Transistor Collector: Doping ~ 1015 cm-3 Neutron and ion Damage
Point defect spectra (electrons) are related to clustered defect spectra (neutrons) Asymmetry of V2
Three Types of “V2” defects Normal V2 – two equal acceptor levels “Strained V2”– single acceptor level “Bistable V2”- two bistable acceptor levels Note the quotes around “V”. We do not know the exact structure or composition of the strained or bistable “V2”.
Partial filling of the shallow V2double acceptor level. Strain-induced inhibition of bond averaging of Jahn-Teller distortion of V2Svensson, et al., Phys. Rev. B 43, 2292 (1991) Different structure of the defect, e.g. V2 + In Why is there a V2asymmetry? Undistorted T > 20 K in c-Si or V2= charge state JT Distorted T < 20 K or strained Si
Gain and Defect Bistability Injection of minority carriers at 300 K causes E4 and E5 to become visible. Annealing at 350 K (80 C) removes E4 and E5. R. M. Fleming, C. H. Seager, D. V. Lang et al., Appl. Phys. Lett. 90, 172105 (2007).
Annealing of Bistable E4-E5 Neutron Damaged
Bistable E4-E5 has the same asymmetry as V2 Asymmetry of E4-E5 acceptor level amplitude is gone after 500 K Bistability remains until 560 K Annealing of Bistable E4-E5
Annealing above 500 K – Bistability goes away, but V2 – like defect remains V2 (-/0) Shift of V2 is associated with transition to V2O L Center
Annealing above 500 K – Bistability goes away, but V2 – like defect remains V2 (-/0) Shift of V2 is associated with transition to V2O Above 500 K, bistable E4-E5 transforms to the stable L center with two levels. L Center L Center has two levels Fleming, et al., J. Appl. Phys. 104, 083702 (2008)
Bistable E4-E5 and V2 Annealing E4-E5 has the same annealing characteristics and level asymmetry as the strained V2seen after neutron or other clustered damage. Fleming, et al., J. Appl. Phys. 104, 083702 (2008)
Kinetics of Bistable V2 Stable phase: E75 Metastable phase: E4, E5, H1 Fleming, et al., J. Appl. Phys. 111, 023715 (2012)
Silicon Bipolar Transistor Base: Doping ~ 1017 cm-3 Neutron and ion Damage
Neutron – Ion Equivalence using EOR Silicon Ions Exact match of neutron & ion DLTS spectra in pnp base Linear relationship between inverse gain and DLTS amplitude Si ion energy chosen to place the ion end-of-range (EOR) at the emitter-base junction
Correlating DLTS & Gain In the npn collector after 550 K, normal V2 remains while the strained V2 has annealed away. Little additional gain recovery occurs after 600 K where the normal V2 anneals. Similar results are obtained for the pnp transistor. Correlate DLTS and gain using the pnp base.
Remove defects by annealing to assign relative importance of defects to gain reduction. NT from DLTS Neutron damaged: NT from transistor currents DC(TA) ~ [VP] fvp(TA) + [V2*] fv(TA) + [V2] Polynomial empirically determined from npn collector Polynomial empirically determined from pnp base = constant Fleming, et al., J. Appl. Phys. 107, 053712 (2010). Fleming, et al., J. Appl. Phys. 108, 063716 (2010).
DLTS in GaAs : Analysis is more complex • Neutron spectra is radically different from electron damage. • The broad features after neutron/ion damage are known as the “U-band” (n-GaAs) and the “L-band” (p-GaAs)
Neutron Damaged GaAs • Neutron damage causes expansion of the GaAs lattice • Decrease of GaAs bandgap • Bandgap decrease of 0.16 eV results in overlap of U- and L-bands & apparent continuous distribution of defect states across midgap • Cause? • Inhomogeneous broadening , e.g. strain broadened defect levels • Homogeneous broadening, e.g. electric-field dependent emission rate Fleming, et al., J. Appl. Phys. 107, 123710 (2010).
Broad U- & L-bands at high doping (neutron damage) • U- and L-bands broaden as doping is increased • Electric fields are higher in high-doped diodes (depletion widths are narrower) • Broadening is suggestive of electric-field enhanced emission due to tunneling
Double DLTS (DDLTS) • If emission from a trap is controlled by tunneling, the emission rate will depend on the E-field (and on doping). • Standard DLTS involves emission from regions with varying E-field, hence DLTS peak shapes will be distorted if tunneling is important. Thermal emission Phonon assisted tunneling Elastic tunneling
DDLTS: Measure Emission Rate at ~ Constant E-field • Electron damage, no clusters • Emission rates increases with applied E-field • Attributed to phonon-assisted tunneling • Schenk, Solid State Electronics 35, 1585 (1992). • Much smaller rate increase in silicon (Frenkel-Poole emission) E-field dependent emission rate in GaAs: Goodman, et al., Jpn. J. Appl. Phys. 33, 1949 (1994). Auret, et al., Semicond. Sci. Technol. 10, 1376 (1995).
Consequences of Tunneling • Larger GR currents at high doping due to higher E-fields • Larger GR currents at lower T SRH is small, but tunneling ~ constant with temperature • Decrease in excess GR currents as forward bias increases due to lower E-field
Clustered damage DLTS spectra of clustered damage similar to point defect spectrum EOR Si ions produce DLTS spectrum close to that of neutron damaged Additional V2-like defects – exact structures are not known “Strained V2” – No double acceptor, very broad annealing profile “Bistable V2” – Annealing kinetics match gain annealing kinetics Metastable levels: E4, E4, H1 (like V2) Single stable level: E75 (very shallow) Use annealing to de-convolve defects in BJT base that affect gain: VP, V2* and V2 Requires knowledge of annealing in low-doped collector Establish ion-neutron equivalence Simple scale factor relates neutrons & EOR Si ions Conclusions: Silicon
Emission from GaAs defects is highly electric-field dependent Consequences on both DLTS and device currents DLTS Electric-field broadened DLTS of electron-damaged diodes resembles DLTS of neutron damage diodes U- and L-bands (neutron & ion damage) are likely a combination of field-broadened DLTS & the effects of additional electric fields from damage clusters Device currents Excess currents in forward biased diodes beyond standard SRH Conclusions: GaAs
Acknowledgements D. King K. McDonald E. Bielejec G. Patrizi J. Campbell D. Serkland S. Myers G. Vizkelethey N. Kolb W. Wampler Special thanks to: D. V. Lang C. H. Seager