Download
1 / 19
190 likes | 302 Views
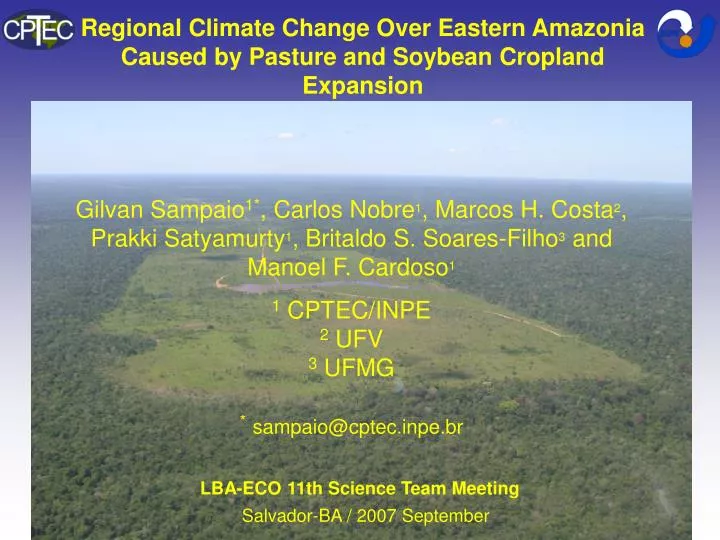
Regional Climate Change Over Eastern Amazonia Caused by Pasture and Soybean Cropland Expansion. Gilvan Sampaio 1* , Carlos Nobre 1 , Marcos H. Costa 2 , Prakki Satyamurty 1 , Britaldo S. Soares-Filho 3 and Manoel F. Cardoso 1 1 CPTEC/INPE 2 UFV 3 UFMG * sampaio@cptec.inpe.br.

E N D
Regional Climate Change Over Eastern Amazonia Caused by Pasture and Soybean Cropland Expansion Gilvan Sampaio1*, Carlos Nobre1, Marcos H. Costa2, Prakki Satyamurty1, Britaldo S. Soares-Filho3 and Manoel F. Cardoso1 1 CPTEC/INPE 2 UFV 3 UFMG *sampaio@cptec.inpe.br LBA-ECO 11th Science Team Meeting Salvador-BA / 2007 September
In the last years, several studies have shown the importance of the tropical rainforests for the Earth’s climate. Field observations (Gash and Nobre, 1997) and numerical studies (e.g. Dickinson and Henderson-Sellers, 1988; Nobre et al., 1991; Hahmann and Dickinson, 1997; Costa and Foley, 2000) reveal that large scale deforestation in Amazonia could alter the regional climate significantly. Evapotranspiration is reduced and surface temperature is increased for pastures. Many AGCM modeling studies have considered the sensitivity of the climate system to a complete conversion of Amazonian rainforest to pasture (Dickinson and Henderson-Sellers, 1988; Nobre et al., 1991, Henderson-Sellers et al., 1993).
EFFECTS OF LARGE SCALE DEFORESTTION P pasture - P forest ( annual, in mm) Oceano Atlântico Cerrado Forest Pasture Caatinga Pacífic Ocean Cerrado Rocha, 2001. • Numerical Simulations of deforestation • 1 to 2.5 C surface temperature increase • 15% to 30% evapotranspiration decrease • 5% to 20% rainfall decrease
What is the relationship between precipitation and Amazonia forest cover ?
Conceptual models of regional deforestation in Amazonia “An alternative pattern could represent first an increase of precipitation as a result of partial deforestation, maybe due to the mesoescale circulations, ... followed by a catastrophic decrease passing some threshold value.” “Increase of the deforested areas Linear decrease of P” “Relatively small deforestation could cause a major decrease of precipitation, with a progressing deforestation not having further significant impact” Avissar et al., 2002
In order to assess the effects of Amazonian deforestation on the regional climate, we used the CPTEC-INPE AGCM driven by land cover maps under a business-as-usual scenario of future deforestation. • Previous studies [Nobre et al., 1991; Lean and Rowntree, 1993, Costa and Foley, 2000; Berbet and Costa, 2003; among others], in general, have considered a single scenario of degraded pasture. • Here, the rainforest is gradually replaced by degraded pasture or by soybean cropland.
PROJECTED SCENARIOS 50% 20% Control 40% 60% 80% 100% or Soybean Vegetation classification Dorman and Sellers (1989) Sampaio et al., 2007 Source: Soares-Filho et al., 2006 and Amazon Scenarios Project, LBA
The land cover change scenarios with deforested areas smaller than 40% are from Soares-Filho et al. [2006]. Their model produces annual maps of simulated future deforestation under user-defined scenarios of highway paving, protected areas networks, protected areas effectiveness, deforestation rates and deforested land ceilings. The land cover change scenarios with deforested areas greater than 40% are obtained using the same methodology extending further into the future the simulation of deforestation under the business-as-usual scenario.
CPTEC GLOBAL MODEL RESULTS
Global Circulation Model – CPTEC/INPE 1.0 • (Kinter et al. 1997, Bonatti, 1996, Cavalcanti et al., 2002) • Model horizontal resolution: T062 (~200km x 200 km) • Vertical levels: 42 • Land surface scheme: Simplified Simple Biosphere Model (SSiB) – Xue et al., 1991 • For each land grid point, a vegetation type (biome) is prescribed, and the vegetation classification follows Dorman and Sellers (1989). A set of physical, morphological, and physiological parameters is assigned to each biome. • Boundary conditions: • Monthly SST: climatological - NCEP-Reynolds e Smith, 1994 • Initial climatological values: soil moisture, albedo and snow depth. • Sea ice: considered at grid points for which SST is below -2ºC.
Experiments: The CPTEC model was integrated for each experiment and control for 87 months with five different initial conditions derived from five consecutive days of NCEP analyses. The results are the mean of the last 60 months (experiment – control). 1) Control case: Today land cover scenario. 2) PASTURE: Land cover change scenarios with deforested areas equal to 20%, 40%, 50%, 60%, 80% and 100% of the original extent of the Amazon forest. 3) SOYBEAN: Land cover change scenarios with deforested areas of 20%, 50%, 80% and 100%. For each scenario a pseudo-equilibrium between the climate and vegetation was obtained.
Based on Nobre el al. [1991], Xue et al. [1996] and the ABRACOS experiment [Gash et al. 1996], we create a new vegetation type called degraded grass (pasture). Based on Costa et al. [2007], we created another new vegetation type called soybean cropland (soybean), which has the physiology of a C3 plant. The modeled soybean crop was planted on 4 February, and harvested on 15 June, and in the remainder of the year the land cover type was bare soil.
These differences arise mainly because the soybean crop was grown only during the first half of the year, becoming bare soil during the remainder of the year. Sampaio et al., 2007 Geophys. Res. Lett., 34
AGCM RESULTS
Amazonia - PASTURE decrease in precipitation associated with pasture expansion Sampaio et al., 2007 Geophys. Res. Lett., 34
Amazonia - SOYBEAN the magnitude of precipitation decrease is higher over soybean than over pasture Sampaio et al., 2007 Geophys. Res. Lett., 34
Precipitation PASTURE SOYBEAN Relative Precipitation The reduction in precipitation occurs mainly during the dry season, and is more evident when the deforested area is larger than 40% ! all Amazonia Sampaio et al., 2007 Geophys. Res. Lett., 34
CONCLUSIONS The results for eastern Amazonia show increase in surface temperature and decrease in evapotranspiration and precipitation. The precipitation change after deforestation over eastern Amazonia is associated with increase in albedo and reduction of evapotranspiration associated with the lower surface aerodynamic roughness, the lower leaf area, and the shallower rooting depth of pasture and soybean cropland compared with forest. The relationship between simulated precipitation and deforestation shows an accelerating decrease of rainfall for increasing deforestation for both classes of land use conversions. The reduction in precipitation in this region is more evident when deforestation exceeds 40% of the original forest cover, and this reduction in precipitation occurs mainly during the dry season. The reduction in precipitation can create favorable conditions to potentially alter the structure of the forests, and lead to a process of savannization, as suggested by some studies [e.g. Nobre et al., 1991; Oyama and Nobre, 2003; Hutyra et al., 2005].