Download
1 / 34
340 likes | 449 Views
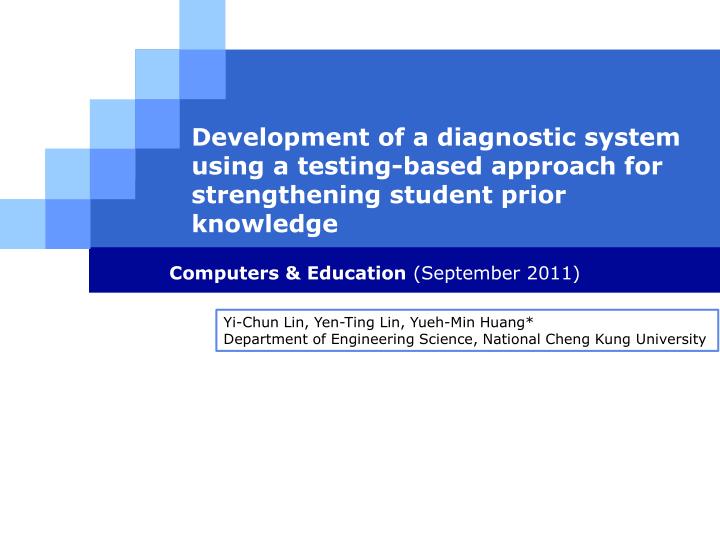
Development of a diagnostic system using a testing-based approach for strengthening student prior knowledge. Computers & Education (September 2011). Yi-Chun Lin, Yen-Ting Lin, Yueh -Min Huang* Department of Engineering Science, National Cheng Kung University. Introduction.

E N D
Development of a diagnostic system using a testing-based approach for strengthening student prior knowledge Computers & Education (September 2011) Yi-Chun Lin, Yen-Ting Lin, Yueh-Min Huang* Department of Engineering Science, National Cheng Kung University
Introduction • Assist instructors in diagnosing and strengthening students’ prior knowledge before new instructions and to enable students to attain greater learning motivation and improved learning performance • A testing-based diagnosis system is proposed in this study to cope with these problems
Methodology • To measure the strength of understanding of prior knowledge • Prior knowledge diagnosis (PKD) model is proposed • Two data sources: • Testing information assigned by teachers • Testing information derived by students Represents a relationship between each concept and test item in a test, and the relationships among the concepts Represents a relationship between student’s answers and the test items
Methodology • A course specifiesn concepts • C1, C2, C3,…, Ci,… Cm,…, Cn • Prior knowledge of the subject forr participating students • S1, S2, S3,…, Sl,…, Sr • Teacher selectk test items from the test item bank to form the pre-test • T1, T2, T3,…, Tj,…, Tk
Methodology • Xmjindicates the degree of relevance between the m-thconcept and the j-thtest item • represent the degree of relevance between each concept and test item • Zim indicates the relationship between the ith and the mthconcepts(ranged from 0 to 1) • represent the relationship between the concepts
Methodology - Strength of concept • The strength of concept Ci in the pre-test • Zim represents the relationship between the i-thand the m-th concepts, 0 ≤ Zim ≤ 1 • Xmj indicates the degree of relevance between the m-thconcept and the j-thtest item, 0 ≤ Xmj ≤ 1 • 0 ≤ S(Ci) ≤ nk
Methodology - Importance ratio of concept • The importance ratio of concept Ci in the pre-test • Zim represents the relationship between the i-thand m-th concepts, 0 ≤ Zim ≤ 1 • Xmj indicates the relevance degree between the m-thconcept and the j-thtest item, 0 ≤ Xmj ≤ 1 0 ≤ IRP(Ci) ≤ 1
Methodology - Understanding strength of the lth student • The understanding strength of the lth student on the ithconcept • Rljindicates the answer of the l-thstudent on the j-thtest item • If the student answers the test item correctly, Rlj is 1; otherwise Rlj is 0 • Zim represents the relationship between the i-thand the m-th concepts • Xmj indicates the degree of relevance between the m-thconcept and the j-thtest item
Methodology - Understanding strength of the concept • Translate the importance ratio of the concept into the understanding strength of the concept • To t(Ci) represents the threshold value of the i-th concept, 0 ≤ t(Ci) ≤ 1 • m indicates the gradient of the function, m = 1 • IRP(Ci) represents the importance ratio of concept Ci in the pre-test, 0 ≤ IRP(Ci) ≤ 1 • b is the point at which the line crosses the y-axis, b = 0
Illustrative example Illustrative example of relationship between test items and concepts
Illustrative example Illustrative example of relationship between concepts
Strength of Concept • The strength of the first concept (C1): • S(C1) = Z11 *X11+ Z11 * X12+ Z13 * X32= 1.0 × 1.0 + 1.0 × 0.2 + 0.4 × 0.6 =1.44 • S(C2) = Z21*X23+Z21* X24+ Z23* X32+ Z25* X52+ Z25 * X54= 1.0*1.0 + 1.0*0.4 + 0.6*0.6 + 0.2*0.2 + 0.2*0.4 =1.88
Importance Ratio of Concept • The importance ratio of second concept (C2) • IRP(C2) = 1.88 / 7.52 = 0.25
Illustrative example Illustrative example of the relationship between students’ answers and test items
Illustrative example Relationship between test items and concepts (X) Relationship between concepts (Z) Relationship between students’ understanding strength and concepts (USS) Relationship between students’ answers and test items (R) USS(S4,C5) = == = 0.79
Illustrative example *m = 1, b = 0 for threshold function in this case
Experiment • Participants : • A course instructor • 80 university students • Course: bioinformatics • Group: • Control group: 40 students (used the PKT&D system) • Experiment group: 40 students (did not use the PKT&D system)
The learning motivation post-test score between the two groups • To measure the students’ learning motivation, Motivated Strategies for Learning Questionnaire was adopted in this study. • using nine questionnaire items and a seven-point Likertscale
The paired t-test results of learning motivation for the two groups of students
Experiment group students’ perceptions of using the PKT&D system Note: EU: Extremely Unlikely; QU: Quite Unlikely; SU: Slightly Unlikely; SL: Slightly Likely; QL: Quite Likely; EL: Extremely Likely.
Independent pre-test on knowledge of bioinformatics of the two groups
The paired t-test results of the learning improvement for the two groups *p<0.05.
Independent Post-test on knowledge of bioinformatics of the two groups
Evaluation of correctness rate results for the three concepts diagnosis • Evaluation of correctness rate results for the three concepts diagnosis • represents the correctness rate of the diagnoses derived from the PKT&D system,
Evaluation of correctness rate results for the three concepts diagnosis
Evaluation of correctness rate results for the five concepts diagnosis Note: Correctness rate obtained by comparing the diagnoses of the experts with those obtained using the proposed approach to artificial intelligence course. The average correctness rates are 90.625% and 90% for the students.
Conclusion & Discussion • Propose a testing-based approach to diagnose the strength of individual students’ prior knowledge of concepts, and then provide them with appropriate materials to strengthen this • Provide instructors can undertake their teaching more smoothly • Educators can use the proposed system in different educational contexts
Limitation • Two variables of the linear function have to be adjusted based on instructors’ expertise in different educational contexts
Future Work • The number of test items in the item bank should be continually increased to address various subject objectives and the instructors’ needs • Students’ learning portfolio can be integrated into the proposed system to develop more appropriate diagnosis mechanisms