Download
1 / 19
190 likes | 313 Views
E-Marketplace Status Update. Andy Bartels Vice President and Research Director November 16, 2000 Call in at ??:?? EDT (1) (973) 321-1020 Password: ????. Agenda. Segmenting the e-marketplace space: extranets and private e-markets vs. EDI and ETN networks vs. public e-markets

E N D
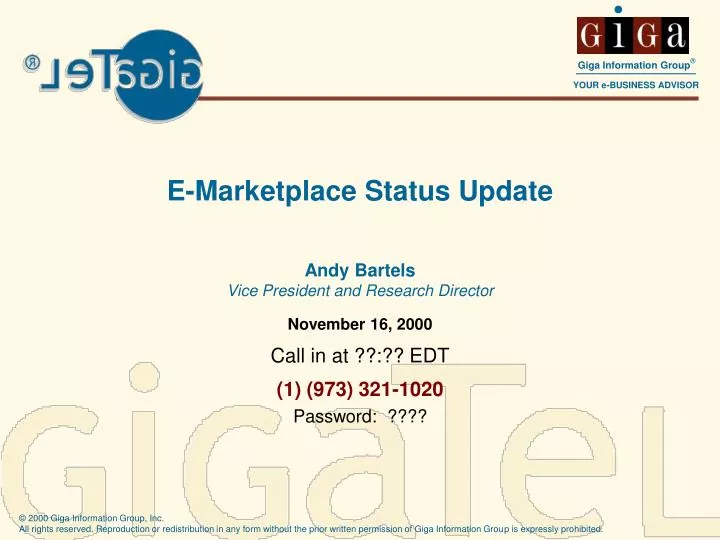
E-Marketplace Status Update Andy Bartels Vice President and Research Director November 16, 2000 Call in at ??:?? EDT (1) (973) 321-1020 Password: ????
Agenda • Segmenting the e-marketplace space: • extranets and private e-markets vs. EDI and ETN networks vs. public e-markets • The dynamics driving e-markets • What will win? • Recommendations for navigating an uncertain landscape
US Business-to-Business (B2B)Internet E-Commerce (Billions) $4,000 $3,697 Web EDI $3,500 $3,158 EDI DirectOver Web $3,000 $2,471 $2,500 EDI viaInternet ETNs $2,000 $1,636 $1,500 Internet E-Markets $1020 $1,000 $611 $295 Extranets $500 $0 1998 1999 2000 2001 2002 2003 2004 The Internet B2B E-Commerce Space Figure 4
US Business-to-Business (B2B)EDI E-Commerce (Billions) $4,000 $3,412 $3,352 $3,500 $3,255 $3,137 Web EDI $3,030 $2,984 $2,908 $3,000 EDI DirectOver Web $2,500 $2,000 EDI viaInternet ETNs $1,500 EDI viaVANs $1,000 $500 $0 1998 1999 2000 2001 2002 2003 2004 The EDI B2B E-Commerce Space Figure 5
EDI and Internet Increasingly Overlap B2B E-Commerce in 2004 Internet EDI EDI ETNs ($1.2 Tril.) Internet Public E-Marketplaces ($1.3 Tril.) EDI with VANs ($1.4 Tril.) EDI Direct ($0.3 Tril.) Extranets* ($0.5 Tril.) Web EDI ($0.4 Tril.) * Includes Private E-Marketplaces Figure 3
Internet E-Market BusinessSellers BusinessBuyers What Are Internet E-Markets?
Secondary Business Seller BusinessBuyers PrivateE-Market Internet Primary Business Seller One-to-Many Extranets Become Some-to-Many Private E-Marketplaces • Companies with successful extranets are adding non-competing complementary suppliers to create a private e-marketplace • Example: Dell’s order system with customers • However, some-to-many (like one-to-many) solutions are only sustainable when the one buyer or the one supplier is the 800-pound gorilla that can force counterparties to do things its way.
True Many-to-Many Marketplaces • Lack of standards limits current availability • May emerge if buyers, sellers and vendors can get together to write the common rules for trading in an industry, e.g., RosettaNet Standardized Order-and-Response Formats Business Buyers Business Sellers Internet
Hub e-market ownership is taking two forms in public e-marketplaces. Option No. 1 New Company Option No. 2 Shared Ownership by Incumbents • No baggage • Nimble • Entrepreneurial • Profits to Incumbents • Control to Incumbents • Quick to Scale Pros • Potential Monopoly • Profits to New Entrant • Slow to Reach Scale • Anti-Trust Issues • Distrust by Other Incumbents • Committee delays Cons Two Dominant Models for Hub E-Markets
Half of Industry-Incumbent Hub E-Markets Will Fail Industry-incumbent consortia can bring scale and liquidity, but can fail because of: • Anti-trust issues • Sub-scale buyer participation • Competitor conflicts • Hub site objectives — profit vs. efficiency? • Hub site scope — preserving or leveling competitive advantages? • Hub site assets — who owns IP, physical assets, management? • Hub site technology — whose favorite vendors get chosen? • Resistance from suppliers • Premature commitment to wrong technologies
Internet InternetE-Market BusinessSellers BusinessBuyers Tensions in Internet Hub E-Markets • Buyer Objectives • Lower prices • Standardize order flow • Find new suppliers • Collaborative planning & forecasting • Market Feature • Reverse auctions • Aggregated catalogs • PO and response conversion • Aggregated catalogs • RFP facilities • SCM-based collaboration • Seller Objectives • Standardize order flow, avoid commoditization • Collaborative planning & forecasting • Find new customers • Move excess inventory • Market Feature • Aggregated catalogs with punch-out to seller Web site • CRM-based collaboration • Supplier search w/ marketing info • Auctions
Evolution of E-Marketplaces • E-marketplaces will move from supporting purchase transactions to more complex collaborative interactions New Entrant E-Markets Collaborative Planning Transactions Private Extranet E-Markets Industry Consortia E-Markets Purchase Transactions 2000 2001 2002 2003 2004
E-Marketplace Revenues • E-marketplaces today are experimenting with a variety of revenue models • Increasingly, they will coalesce around a subscription model Today Monthly Subscription Fee (e.g., PurchasePro) AND/OR Sales Commission Paid by Seller (e.g., 1%-5% for MetalSite, ChemDex) AND/OR Transaction and Listing Fees by Seller (e.g., PurchasePro) AND/OR Percent of Savings Fee by Buyer (e.g., FreeMarket) 2001 Monthly Subscription FeeTiered by Size Of Participant And Service OR Percent of Savings Fee by Buyer (for Reverse Auctions)
Percentage of B2B Internet commerce transactions flowing through hub sites Number of transactional hub sites 40% 35% 30% 10,000 25% 7,500 20% 5,000 15% 2,500 10% 1,000 5% 0% 0 1999 2000 1999 2000 2001 2002 Growth in B2B Internet Commerce via Hub E-Markets
EDI/ETNs/Extranets/DirectTightly coupled, secure, often proprietary network channels for large and medium company bilateral long-term partner relations Internet E-MarketsLoosely coupled, moderately secure Internet-based extranets, hub sites and marketplaces for more transitory partner relations for large, medium and small organizations Distributors Or Suppliers Sales Or Purchases 20% 80% Distributors Or Suppliers Sales Or Purchases 20% 80% Large Companies Will Use Different B2B Electronic Channels
Not all “strategic” relationships are strategic to both parties. Caveat to the 80/20 Rule: Asymmetry of Strategic Relationships 10% of Sales = Strategic Customer > 1% of Purchases = Non-Strategic Supplier Manufacturer Retailer • In these cases, retailer will try to push manufacturer onto an e-market;manufacturer needs to find ways to keep relationship of the e-market.
B2B Commerce Will Continue to Go Through Multiple Channels US B2B Sales By Channel, 2002(Total = $12.6 Trillion) 0.3% Catalog 3.2% Internet E-Markets 1.4% Direct Marketing 5.8% Internet E-Markets 23% Salesforce & in store 15.5% EDI with VAN s 5.6% EDI with Internet ETNs 1.6% EDI Direct Via Web 3.1% Web EDI 43% Sales force & in store influenced by Internet Source: Giga Information Group Figure 2
Orders 2000 Orders 2004 Store Sales Person Traditional Telephone Mail EDI-VAN Proprietary Electronic Leased Line Dial-Up Web EDI EDI-ETN Internet Electronic Direct EDI Extranets E-Markets Key Business Challenge: Managing Multiple E-Channels Figure 1
Conclusions and Recommendations • E-marketplaces will play an increasing role in B2B e-commerce. • Industry-consortia-owned e-marketplaces will tend to prevail over new-entrant e-markets or private extranet-based e-markets – but not always. • Will move from payment transactions to collaboration • Will be run as non-profit co-ops with subscription revenues • But e-marketplaces will be one of many channels used in B2B e-commerce. • Companies will need to have explicit e-channel management strategies — use right channel for right customer or supplier relationship. • Companies will have multiple e-channels to integrate.