
Uploaded by
marcus
1 SLIDES
85 VIEWS
10LIKES
Podocyte CatL Activity and pH Variability in Wild Type Models
DESCRIPTION
This study examines the pH variability of CatL activity in podocytes using time courses at different pH values. Mean values and standard errors were calculated at each pH, projecting the podocyte pH for different models on the CatL activity curve.
Download
1 / 1
Download Presentation 
Podocyte CatL Activity and pH Variability in Wild Type Models
An Image/Link below is provided (as is) to download presentation
Download Policy: Content on the Website is provided to you AS IS for your information and personal use and may not be sold / licensed / shared on other websites without getting consent from its author.
Content is provided to you AS IS for your information and personal use only.
Download presentation by click this link.
While downloading, if for some reason you are not able to download a presentation, the publisher may have deleted the file from their server.
During download, if you can't get a presentation, the file might be deleted by the publisher.
E N D
Presentation Transcript
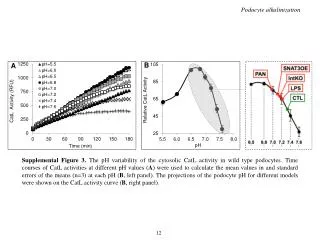
Podocyte alkalinization B A Supplemental Figure 3. The pH variability of the cytosolic CatL activity in wild type podocytes. Time courses of CatL activities at different pH values (A) were used to calculate the mean values in and standard errors of the means (n=3) at each pH (B, left panel). The projections of the podocyte pH for different modelswere shown on the CatL activity curve (B, right panel). 12


More Related