Download
1 / 27
270 likes | 355 Views
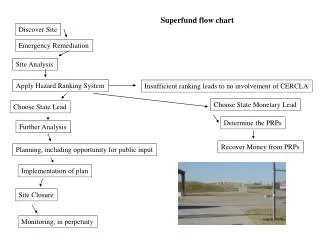
2012 Bunker Hill Superfund Site Coeur d’Alene Basin Blood Lead Levels. Panhandle Health District Idaho Department of Environmental Quality United States Environmental Protection Agency Idaho Department of Health and Welfare November 7, 2012. Lead Health Intervention Program (LHIP)

E N D
2012 Bunker Hill Superfund Site Coeur d’Alene BasinBlood Lead Levels Panhandle Health District Idaho Department of Environmental Quality United States Environmental Protection Agency Idaho Department of Health and Welfare November 7, 2012
Lead Health Intervention Program (LHIP) Annual Blood Lead Surveys • Public health service offered by the State • Not a study or experiment • Box since 1974/1985 • Basin since 1996
Panhandle Health District LHIP Procedures • No cash incentive for participants that live: • within the Box and are between 6 months and 9 years of age, or • $20.00cash incentive for participants that live: • within the Coeur d’Alene River Basin and are between • 6 months and 6 years of age • Prior to blood draws, the parent/legal guardian or adult • participant must sign a Consent Form and complete the • appropriate Questionnaire
Panhandle Health District LHIP Procedures • Screening blood test is done by skin puncture (capillary • or fingerstick - FS) • Results of capillary test are provided to the participant or • parent immediately after analysis
Decreasing “elevated”blood lead levels Blood Lead Concentrations Considered to be Elevated by the Centers for Disease Control and Prevention. *N Engl J Med 2003; 348: p1517-26 (1950 – 1991) *CDC. Recommendations in “Low Level Lead Exposure Harms Children: A Renewed Call of Primary Prevention”. (2012)
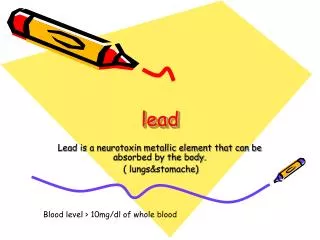
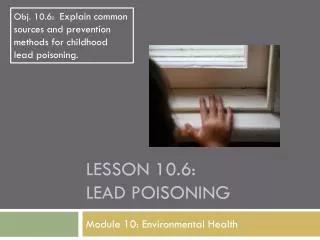
Neurotoxic Effects • Neurobehavioral effects in early development persist into adolescence and young adulthood • Neurocognative effects associated blood lead levels of 5-10 μg/dl • A decline of 6.2 IQ points results from a blood lead change from 1 to 10 μg/dl (pooled results from 7 studies)
Cardiovascular Effects • Increase in blood pressure (hypertension)
Other Organ and System Effects • Renal effects • Immune system effects • Bone and teeth effects • Heme-synthesis effects • Reproductive and developmental effects • Adrenal effects • Liver Effects • Gastrointestinal Effects • Metabolism Effects • Genotoxic Effects • Carcinogenic Effects
At Risk Populations • Children • Pregnant women • Adults with cumulative exposure • Genetically pre-disposed Individuals
“There is no level of Pb exposure that has yet been identified, with confidence, as clearly not being associated with possible risk of deleterious health effects.”
Bunker Hill Box Average Blood Lead: 1974-2002 “Elevated” blood lead level U.S. Average * * * *
Bunker Hill Box Superfund Site Remedial Action Objective • 95% of all children in each community with blood lead levels <10 µg/dl • No children (i.e. <1%) with blood lead levels > 15 µg/dl
Box Lead Health Intervention Summary Statistics 1988-1994 Number of Mean Number of children Percent children blood Pb with blood Pb (mg/dl) of children Year in survey (mg/dl) >25 >15 >10 > 10 mg/dl 1988* 230 9.9 7 35 105 46% 1989* 275 11.4 8 71 154 56% 1990 362 8.9 2 41 134 37% 1991 365 6.3 2 17 56 15% 1992 415 7.4 3 31 110 27% 1993 445 5.6 1 10 66 15% 1994 416 6.2 1 15 71 17% *does not include Pinehurst
Box Lead Health Intervention Summary Statistics 1995-2002 Number of Mean Number of children Percent children blood Pb with blood Pb (µg/dl) of children Year in survey (µg/dl) >25 >15 >10 > 10 µg/dl 1995 405 6.0 2 20 62 15% 1996 397 5.8 2 13 49 12% 1997 337 5.4 0 6 36 11% 1998 375 4.8 0 5 31 8% 1999 370 4.7 0 3 23 6% 2000 320 4.3 0 5 17 5% 2001 322 3.2 0 4 10 3% 2002 368 3.1 0 3 7 2%
2012 Blood Lead Summary Statistics – Box (age 0-9) Total Number of Children (N) 8 Minimum (μg/dl) 1.6 Maximum (μg/dl) 4.1 Average (μg/dl) 2.6 Standard Deviation 0.8 Geometric Mean (μg/dl) 2.4 Geometric Standard Deviation 1.4 Number Percentage Children’s blood lead > 5 μg/dl 0 0% Children’s blood lead > 10 μg/dl 0 0% Children’s blood lead > 15 μg/dl 0 0%
2012 Blood Lead Summary Statistics – Basin (age 0-6) Total Number of Children (N) 83 Minimum (μg/dl) 1.0 Maximum (μg/dl) 8.0 Average (μg/dl) 3.3 Standard Deviation 1.2 Geometric Mean (μg/dl) 3.1 Geometric Standard Deviation 1.4 Number Percentage Children’s blood lead > 5 μg/dl 5 6% Children’s blood lead > 10 μg/dl 0 0% Children’s blood lead > 15 μg/dl 0 0%
Basin Blood Lead Summary by Year, 1996 - 2003 (age 0-6 only) *1 child from 2000 was removed from the summary because the associated address was outside the Basin boundaries.
Basin Blood Lead Summary by Year, 2004 - 2012 (age 0-6 only) *2 children from 2004 were removed from the summary because the associated addresses were outside the Basin boundaries.
2012 Basin Blood Lead Summary Statistics by Area
2012 Basin Blood Lead Summary Statistics by Area
2012 Basin Blood Lead Summary Statistics by Age (years)