Download
1 / 26
260 likes | 373 Views
The use of models in DEB research. Bas Kooijman Dept theoretical biology Vrije Universiteit Amsterdam Bas@bio.vu.nl http://www.bio.vu.nl/thb /. Nijmegen, 2005/02/23. Contents. DEB theory introduction Scales in space & time Empirical cycle Dimensions Plasticity in parameters

E N D
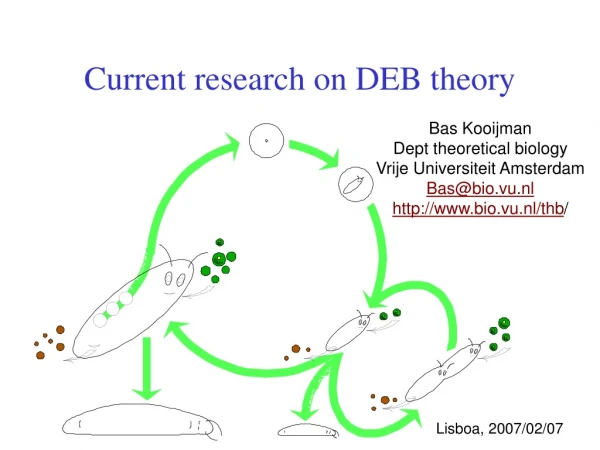
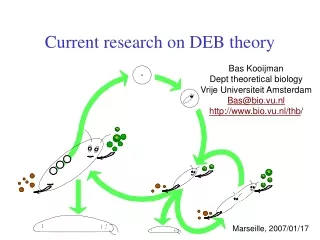
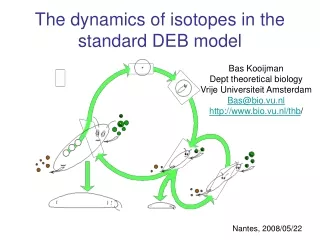
The use of models in DEB research Bas Kooijman Dept theoretical biology Vrije Universiteit Amsterdam Bas@bio.vu.nl http://www.bio.vu.nl/thb/ Nijmegen, 2005/02/23
Contents • DEB theory • introduction • Scales in space & time • Empirical cycle • Dimensions • Plasticity in parameters • Stochastic vs deteriministic • Dynamical systems Nijmegen, 2005/02/23
Dynamic Energy Budget theoryfor metabolic organisation • Uptake of substrates (nutrients, light, food) • by organisms and their use (maintenance, growth, • development, reproduction) • First principles, quantitative, axiomatic set up • Aim: Biological equivalent of Theoretical Physics • Primary target: the individual with consequences for • sub-organismal organization • supra-organismal organization • Relationships between levels of organisation • Many popular empirical models are special cases of DEB
DEB theory is axiomatic, based on mechanisms not meant to glue empirical models Since many empirical models turn out to be special cases of DEB theory the data behind these models support DEB theory This makes DEB theory very well tested against data Empirical special cases of DEB
Some DEB pillars • life cycle perspective of individual as primary target • embryo, juvenile, adult (levels in metabolic organization) • life as coupled chemical transformations (reserve & structure) • time, energy & mass balances • surface area/ volume relationships (spatial structure & transport) • homeostasis (stoichiometric constraints via Synthesizing Units) • syntrophy (basis for symbioses, evolutionary perspective) • intensive/extensive parameters: body size scaling
defecation feeding food faeces assimilation reserve somatic maintenance maturity maintenance 1- maturation reproduction growth maturity offspring structure Basic DEB scheme
Space-time scales Each process has its characteristic domain of space-time scales system earth space ecosystem population When changing the space-time scale, new processes will become important other will become less important Individuals are special because of straightforward energy/mass balances individual cell time molecule
Modelling 1 • model: • scientific statement in mathematical language • “all models are wrong, some are useful” • aims: • structuring thought; • the single most useful property of models: • “a model is not more than you put into it” • how do factors interact? (machanisms/consequences) • design of experiments, interpretation of results • inter-, extra-polation (prediction) • decision/management (risk analysis)
Modelling 2 • language errors: • mathematical, dimensions, conservation laws • properties: • generic (with respect to application) • realistic (precision) • simple (math. analysis, aid in thinking) • plasticity in parameters (support, testability) • ideals: • assumptions for mechanisms (coherence, consistency) • distinction action variables/meausered quantities • core/auxiliary theory
Dimension rules • quantities left and right of = must have equal dimensions • + and – only defined for quantities with same dimension • ratio’s of variables with similar dimensions are only dimensionless if • addition of these variables has a meaning within the model context • never apply transcendental functions to quantities with a dimension • log, exp, sin, … What about pH, and pH1 – pH2? • don’t replace parameters by their values in model representations • y(x) = a x + b, with a = 0.2 M-1, b = 5 y(x) = 0.2 x + 5 • What dimensions have y and x? Distinguish dimensions and units!
Models with dimension problems • Allometric model: y = a W b • y: some quantity a: proportionality constant • W: body weight b: allometric parameter in (2/3, 1) • Usual form ln y = ln a + b ln W • Alternative form: y = y0 (W/W0 )b, with y0 = a W0b • Alternative model: y = a L2 + b L3, where L W1/3 • Freundlich’s model: C = k c1/n • C: density of compound in soil k: proportionality constant • c: concentration in liquid n: parameter in (1.4, 5) • Alternative form: C = C0 (c/c0 )1/n, with C0 = kc01/n • Alternative model: C = 2C0 c(c0+c)-1 (Langmuir’s model) • Problem: No natural reference values W0 , c0 • Values of y0 , C0 depend on the arbitrary choice
Allometric functions Two curves fitted: a L2 + b L3 with a = 0.0336 μl h-1 mm-2 b = 0.01845 μl h-1 mm-3 a Lb with a = 0.0156 μl h-1 mm-2.437 b = 2.437 O2 consumption, μl/h Length, mm
Model without dimension problem Arrhenius model: ln k = a – T0 /T k: some rate T: absolute temperature a: parameter T0: Arrhenius temperature Alternative form: k = k0exp{1 – T0 /T}, with k0 = exp{a – 1} Difference with allometric model: no reference value required to solve dimension problem
Arrhenius relationship ln pop growth rate, h-1 r1 = 1.94 h-1 T1 = 310 K TH = 318 K TL = 293 K TA = 4370 K TAL = 20110 K TAH = 69490 K 103/T, K-1 103/TH 103/TL
Biodegradation of compounds n-th order model Monod model ; ; X : conc. of compound, X0 : X at time 0 t : time k : degradation rate n : order K : saturation constant
Biodegradation of compounds n-th order model Monod model scaled conc. scaled conc. scaled time scaled time
Plasticity in parameters • If plasticity of shapes of y(x|a) is large as function of a: • little problems in estimating value of a from {xi,yi}i • (small confidence intervals) • little support from data for underlying assumptions • (if data were different: other parameter value results, • but still a good fit, so no rejection of assumption)
Stochastic vs deterministic models • Only stochastic models can be tested against experimental data • Standard way to extend deterministic model to stochastic one: • regression model: y(x| a,b,..) = f(x|a,b,..) + e, with eN(0,2) • Originates from physics, where e stands for measurement error • Problem: • deviations from model are frequently not measurement errors • Alternatives: • deterministic systems with stochastic inputs • differences in parameter values between individuals • Problem: • parameter estimation methods become very complex
Statistics • Deals with • estimation of parameter values, and confidence in these values • tests of hypothesis about parameter values • differs a parameter value from a known value? • differ parameter values between two samples? • Deals NOT with • does model 1 fit better than model 2 • if model 1 is not a special case of model 2 • Statistical methods assume that the model is given • (Non-parametric methods only use some properties of the given • model, rather than its full specification)
Dynamic systems Defined by simultaneous behaviour of input, state variable, output Supply systems: input + state variables output Demand systems input state variables + output Real systems: mixtures between supply & demand systems Constraints: mass, energy balance equations State variables: span a state space behaviour: usually set of ode’s with parameters Trajectory: map of behaviour state vars in state space Parameters: constant, functions of time, functions of modifying variables compound parameters: functions of parameters
Embryonic development 3.7.1 Crocodylus johnstoni, Data from Whitehead 1987 embryo yolk O2 consumption, ml/h weight, g time, d time, d : scaled time l : scaled length e: scaled reserve density g: energy investment ratio ;
C,N,P-limitation N,P reductions N reductions P reductions Nannochloropsis gaditana (Eugstimatophyta) in sea water Data from Carmen Garrido Perez Reductions by factor 1/3 starting from 24.7 mM NO3, 1.99 mM PO4 CO2 HCO3- CO2 ingestion only No maintenance, full excretion 79.5 h-1 0.73 h-1
C,N,P-limitation Nannochloropsis gaditana in sea water half-saturation parameters KC = 1.810 mM for uptake of CO2 KN = 3.186 mM for uptake of NO3 KP = 0.905 mM for uptake of PO4 max. specific uptake rate parameters jCm = 0.046 mM/OD.h, spec uptake of CO2 jNm = 0.080 mM/OD.h, spec uptake of NO3 jPm = 0.025 mM/OD.h, spec uptake of PO4 reserve turnover rate kE = 0.034 h-1 yield coefficients yCV = 0.218 mM/OD, from C-res. to structure yNV = 2.261 mM/OD, from N-res. to structure yPV = 0.159 mM/OD, from P-res. to structure carbon species exchange rate (fixed) kBC = 0.729 h-1 from HCO3- to CO2 kCB = 79.5 h-1 from CO2 to HCO3- initial conditions (fixed) HCO3- (0) = 1.89534 mM, initial HCO3- concentration CO2(0) = 0.02038 mM, initial CO2 concentration mC(0) = jCm/ kE mM/OD, initial C-reserve density mN(0) = jNm/ kE mM/OD, initial N-reserve density mP(0) = jPm/ kE mM/OD, initial P-reserve density OD(0) = 0.210 initial biomass (free)
Vacancies at VUA-TB • PhD 4 yr: 2005/02 – 2009/02 EU-project Modelkey • Effects of toxicants on canonical communities • Postdoc 2 yr: 2006/02 – 2008/02 EU-project Modelkey • Effects of toxicant in food chains • PhD 4 yr: 205/06/01 – 2009/06/01 EU-project Nomiracle • Toxicity of mixtures of compounds
Further reading Basic methods of theoretical biology freely downloadable document on methods http://www.bio.vu.nl/thb/course/tb/ Data-base with examples, exercises under construction Dynamic Energy Budget theory http://www.bio.vu.nl/thb/deb/