Download
1 / 34
340 likes | 460 Views
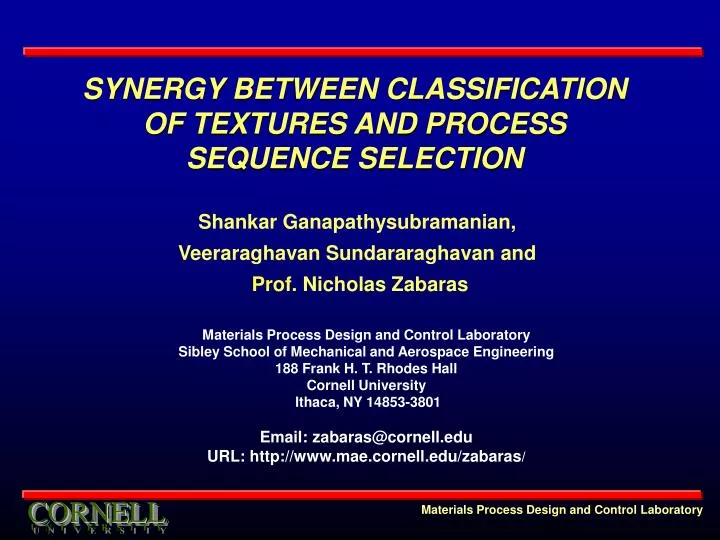
SYNERGY BETWEEN CLASSIFICATION OF TEXTURES AND PROCESS SEQUENCE SELECTION. Shankar Ganapathysubramanian, Veeraraghavan Sundararaghavan and Prof. Nicholas Zabaras. Materials Process Design and Control Laboratory Sibley School of Mechanical and Aerospace Engineering 188 Frank H. T. Rhodes Hall

E N D
SYNERGY BETWEEN CLASSIFICATION OF TEXTURES AND PROCESS SEQUENCE SELECTION Shankar Ganapathysubramanian, Veeraraghavan Sundararaghavan and Prof.Nicholas Zabaras Materials Process Design and Control Laboratory Sibley School of Mechanical and Aerospace Engineering188 Frank H. T. Rhodes Hall Cornell University Ithaca, NY 14853-3801 Email: zabaras@cornell.edu URL: http://www.mae.cornell.edu/zabaras/ Materials Process Design and Control Laboratory
Design processes to produce highly optimized microstructure with directional material properties Boeing 747 GE 90 • Especially important for critical hardware components in the aerospace, naval and automotive industry to reduce material utilization for reduced process cost, fuel consumption and higher mobility • Reduce dependence on other expensive methods such as alloying MOTIVATION FOR MICROSTRUCTURE BASED DESIGN • Modern aircraft engine design and materials selection is an extremely challenging area. Desired directional properties include: • strength at high temperatures, R-values • elastic, creep, fatigue & fracture properties • thermal expansion, corrosion resistance • machinability properties Developing advanced materials for gas turbine engines is expensive – Is it possible to control material properties and product performance through deformation processes? Materials Process Design and Control Laboratory
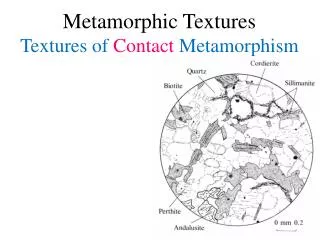
Properties • Averaging principles • Pole figures => ODF • Model validation • Friction Tool wear • Geometric parameters • Process parameters • Material interaction • Material composition MICROSTRUCTURE-PROPERTY-PROCESSING TRIANGLE Microstructure Identify processes for desired microstructure for optimal properties. TEM 3 FOLD DESIGN • Texture • Defects • Composition Processing Realistic process sequence selection Materials and process modeling Materials Process Design and Control Laboratory
INTELLIGENT MICROSTRUCTURE PROCESSING Desired state => Microstru-cture Materials Process Design and Control Laboratory Sensors for process parameters Sensors for Microstructure (imaging techniques) MATERIAL MICROSTRUCTURE Machine vision algorithms Process controller Automatic texture recognition SIMULATION MATCHING DESIGN Reduced representation Physical models STATISTICAL LEARNING TOOLBOX Life & response prediction
Fn+1 x = x(X, t; β) B0 X ~ Ω =Ω (r, t; L) PROCESS MODELING & DESIGN: A POLYCRYSTAL PLASTICITY BASED APPROACH Micro problem driven by the velocity gradient L Macro problem driven by the macro-design variable β Bn+1 L = L (X, t; β) Polycrystal plasticity L = velocity gradient • Kumar & Dawson, CMAME 1997 • Zabaras, IJP 2004, Acta. Mat 2003 • Design variables (β) are macro • design variables • Die shapes • Preform shapes • Processing conditions • Etc. Design objectives are micro-scale averaged material/process properties Materials Process Design and Control Laboratory
F F F F F F B F B B B o o e p * p (1) Single crystal plasticity (1) Continuum framework (2) State evolves for each crystal (2) State variable evolution laws The effectiveness of design for desired product properties is limited by the ability of phenomenological state-variables to capture the dynamics of the underlying microstructural mechanisms (3) Ability to tune microstructure for desired properties (3) Desired effectiveness in terms of state variables Initial design 3 3 8 4 3 7 Polycrystal plasticity provides us with the ability to capture material properties in terms of the crystal properties. This approach is essential for realistic design leading to desired microstructure-sensitive properties Optimal design ? 2 4 6 5 7 3 FROM PHENOMENOLOGY TO POLYCRYSTAL PLASTICITY Phenomenology Polycrystal plasticity Initial configuration Deformed configuration Initial configuration Deformed configuration s0 s n n0 s0 n0 Intermediate thermal configuration Stress free (relaxed) configuration Stress free (relaxed) configuration Need for polycrystalline analysis Challenges in polycrystalline analysis Enormous degrees of freedom limits the scope of design: Average # degrees of freedom ~ 1.4 mil Solution: Microstructure model reduction Materials Process Design and Control Laboratory
MICROSTRUCTURE REDUCED-MODEL REPRESENTATION Materials Process Design and Control Laboratory Method of snapshots Suppose we had a collection of data (from experiments or simulations) for the ODF: Solve the optimization problem Is it possible to identify a basis where such that it is optimal for the data represented as Eigenvalue problem where POD technique – Proper Orthogonal Decomposition
DECOMPOSITION OF THE VELOCITY GRADIENT Plane strain compression Uniaxial tension Shear Design vectorα = {α1, α2, α3, α4, α5} Design problem: Determine α so as to obtain desired properties in the final product. Materials Process Design and Control Laboratory
Full model VALIDATION OF REDUCED REPRESENTATION Uniaxial tension test α = {1,0,0,0,0} t = 0.1 s Reduced model (Basis II) Reduced model (Basis I) • Basis – I 3 POD modes from a uniaxial tension test with strain rate of 1s-1 for t=0.2 s • Basis – II 9 POD modes from five tests (αi= 1s-1 for the ith test, αj= 0, i ≠ j ) for t = 0.2 s Materials Process Design and Control Laboratory
DESIGN FOR MICROSTRUCTURE SENSITIVE PROPERTIES - Hysteresis loss Crystal <100> direction. Easy direction of magnetization – zero power loss Normalized objective function h External magnetization direction Hyteresis loss Design Problem Normalized hysteresis loss Desired value: α ={1,0,0,0,0} Initial guess: α ={0.5,0,0,0,0} Converged solution: α = {0.987,0.011,0,0,0} Reduced order solution using basis II at t = 0.1 s Materials Process Design and Control Laboratory
1 . 5 1 . 2 5 n o 1 i t c n u f e 0 . 7 5 v i t c e j b O 0 . 5 0 . 2 5 0 0 1 0 2 0 I t e r a t i o n i n d e x DIRECTIONAL DEPENDENCE OF ELASTIC MODULUS Control of the distribution of Elastic modulus (away from the rolling direction) through a novel deformation process (design) 1 4 6 Desired distribution 1 4 5 . 5 Reduced-order model: 17 modes (dof). Basis generated from an ensemble of 300. Full-order model: 800*8 = 6400 dof 1 4 5 Elastic moduli (GPa) 1 4 4 . 5 Random texture Optimum 1 4 4 Initial guess 1 4 3 . 5 0 1 0 2 0 3 0 4 0 5 0 6 0 7 0 8 0 9 0 Angle from the rolling direction Desired value: α ={0.6,0,0,0,0} Initial guess: α ={0.3,0,0,0,0} Converged solution: α = {0.68,0.14,0.08,0.01,0.03} Materials Process Design and Control Laboratory
QUESTIONS TO BE ADDRESSED Materials Process Design and Control Laboratory SYNERGY: Synergy between classification of texture and process selection? DIGITAL LIBRARY: Can statistical learning techniques be used to classify textures (microstructure in general) and update the library dynamically? DESIGN: Can the desired property distribution be used along with the digital library to develop a good initial guess for the required process sequencing? REAL TIME CONTROL: How do the developed solutions fit in a multi-length scale design methodology?
INTELLIGENT MICROSTRUCTURE PROCESSING Desired state => Microstru-cture Materials Process Design and Control Laboratory Sensors for process parameters Sensors for Microstructure (imaging techniques) MATERIAL MICROSTRUCTURE Machine vision algorithms Process controller Automatic texture recognition SIMULATION MATCHING DESIGN Reduced representation Physical models STATISTICAL LEARNING TOOLBOX Life & response prediction
INFORMATION THEORY FOR MATERIALS PROCESSES STATISTICAL LEARNING TOOLBOX NUMERICAL SIMULATION OF MATERIAL RESPONSE PROCESS DESIGN ALGORITHMS • Functions: • Classification methods • Identify new classes • Multi-length • scale analysis • Polycrystalline • plasticity • 1. Exact methods • (CSM, DDM, FDM) • Heuristic methods Materials Process Design and Control Laboratory Training samples Process controller Update data In the library Image ODF Associate data with a class; update classes Pole figures
CLASSIFICATION BASED ON SUPPORT VECTOR MACHINES (SVM) Margin (w) Training features B C Class-B Class-A C Class-C A B A Given N samples: (xi,yi) where ‘x’ is a feature vector and ‘y’ is the class label for data point, Find a classifier with the decision function, f(x) such that y = f(x), where y is the class label for x. • One Against One Method: • Step 1: Pair-wise classification, K(K-1)/2 for a K class problem • Step 2: Given a data point, select class with maximum votes out of K(K-1)/2 Materials Process Design and Control Laboratory
STATISTICAL LEARNING TOOLBOX Materials Process Design and Control Laboratory Library of training samples from numerical & experimental tests I) Training steps • Identify classes • Develop feature measures • Train statistical models like Support Vector Machines II) Model testing and validation • Identify reduced bases using the • POD/PCA analysis. These bases will • be used in process simulation. Digital library
STATISTICAL LEARNING TOOLBOX Materials Process Design and Control Laboratory • Can offline knowledge • be used to identify the • process sequence leading to the desired ODF? • Methodology: • Create a digital library using experimental or computational snapshots of microstructures. • Classification is based on a combination of process sequences. • Use multiple levels (or hierarchies) • of classification. Desired ODF/texture
STATISTICAL LEARNING TOOLBOX Materials Process Design and Control Laboratory LEVEL – I CLASSIFICATION SVM Step 1 – Identify dominant process Digital library Plane strain Compression (P) Shear – 1 (S1) Tension (T) Given ODF/texture Shear – 2 (S2) Shear – 3 (S3)
STATISTICAL LEARNING TOOLBOX Tension (T) Plane strain Compression (P) Shear – 1 (S1) Shear – 2 (S2) Shear – 3 (S3) Materials Process Design and Control Laboratory LEVEL – I CLASSIFICATION SVM Step – Identify dominant process Stage 1 Given ODF/texture
STATISTICAL LEARNING TOOLBOX LEVEL – I CLASSIFICATION Tension identified LEVEL – 2 CLASSIFICATION SVM Step – Identify secondary process T+S3 T+P Materials Process Design and Control Laboratory Tension (T) Stage 1 Stage 2 Given ODF/texture T+S2 T+S1 Secondary modes – Secondary process identified as plane strain compression
STATISTICAL LEARNING TOOLBOX LEVEL – I CLASSIFICATION Tension identified LEVEL – 2 CLASSIFICATION Plane strain compression T+P Materials Process Design and Control Laboratory Tension (T) Stage 1 Stage 2 Tree structure classification Stage 3 Given ODF/texture
STATISTICAL LEARNING TOOLBOX LEVEL – I CLASSIFICATION Tension identified Actual process T+P+S1 LEVEL – 3 CLASSIFICATION T + P + Shear-1 T+P Materials Process Design and Control Laboratory Tension (T) Stage 1 Stage 2 Stage 3 T+P+S1 Given ODF/texture LEVEL – 2 CLASSIFICATION Tension + Plane strain compression
TREE STRUCTURE ? Design of Dies Design of Preforms Desired Final Shape Stages Stage 1 ? Stage 2 ? ? ? Stage 3 Materials Process Design and Control Laboratory Classification level Given ODF Level 1 Mode 1 Mode 4 Number of stages Level 2
Cost of Dies Energy Consumption Material Usage Cost Function + + = n i=1 m min J=1 DEVELOPMENT OF MULTI-STAGE PROCESSES Initial Product Based on the statistical “designer knowledge”, evaluate practicable stage number (n) and select a process sequence p from all feasible paths (j=1 … m), such that: Node: Intermediate preform 1st Stage Arc:Processing Stage • such that: • Equipment constraint (press force, ram speed, maximum stroke, etc) • Process temperature constraint • Other process constraints ith Stage • Number of stages - n • Force constraints for each stage • Stroke allocation for each stage • Stage temperature, etc. Finishing Stage(nth) Final Product Optimal Path (pth) Feasible Paths (jth) Materials Process Design and Control Laboratory
IN A MULTISTAGE DESIGN PROBLEM • Objective: • Minimize the gap between • the finishing die and the • workpiece • in a • two stage forging; • with given finishing die; • unknown die but prescribed • stroke in the preforming • stage. Preforming Stage Finishing Stage Unfilled cavity Initial Design Less unfilled region Iteration No. 2 Fully filled cavity Final Design Materials Process Design and Control Laboratory
SAMPLE PROBLEM OF PROCESS CONTROL Identify the process sequence and process parameters to obtain the following ODF for a given F.C.C material • Key assumptions: • 2 unknown process stages • Each stage acts for 10 seconds • Random initial (stage 1) microstructure • Find: • The type of the two unknown stages • Velocity gradients in each stage, i.e. find • α = {α1, α2, α3, α4, α5} Materials Process Design and Control Laboratory
SAMPLE PROBLEM OF PROCESS CONTROL SVM CHARACTERIZATION RESULTS Stage 1 – Tension Stage 2 – Plane strain compression Statistical Methods Materials Process Design and Control Laboratory
POD MODEL REDUCTION Reduced ODF basis COMBINED POD BASIS PROCESS TUNING BY OPTIMIZATION SYNERGY OF MODEL REDUCTION AND CLASSIFICATION Desired ODF Process 2 T+P CLASSIFICATION TREE Process 1 Tension Materials Process Design and Control Laboratory
SAMPLE PROBLEM OF PROCESS CONTROL SVM CHARACTERIZATION RESULTS Stage 1 – Tension Stage 2 – Plane strain compression Statistical Methods • PROCESS SIMULATION • polycrystalline plasticity • Visco-plastic analysis • PROCESS DESIGN • Design for process strain rates • Heuristic design algorithm – simulated annealing • Initial guess {0.3, 0.0} OPTIMUM SOLUTION Stage 1: α = {0.68, 0, 0, 0, 0} Stage 2: α = {0, 0.28, 0, 0, 0} Materials Process Design and Control Laboratory
SAMPLE PROBLEM OF PROCESS CONTROL Process identified: Stage 1 – Tension, Stage 2 – Plane strain compression Stage 1: α = {0.68, 0, 0, 0, 0} Stage 2: α = {0, 0.28, 0, 0, 0} Desired ODF ODF from optimum solution Global solution Original process used to generate desired ODF: Stage 1 – Tension, Stage 2 – Plane strain compression Stage 1: α = {0.7, 0, 0, 0, 0} Stage 2: α = {0, 0.3, 0, 0, 0} Materials Process Design and Control Laboratory
RELEVANT FEATURES • Generated a digital library for texture • Incorporated statistical learning techniques for accelerated materials and process design • Process sequence selection through classification techniques • Classification also used for the selection of predominant modes and reduced-model representation of the microstructure • Techniques were incorporated into a computational process design framework Materials Process Design and Control Laboratory
Orientation space Ѕ BETTER MECHANICS • ThermoElasto-ViscoPlastic analysis • Coupled length scale design methods • Reduced order modeling techniques • Polycrystalline plasticity x(X, t) F(X, t) Texture map χ Texture map χt r s Reorientation map r(s, t) ^ Reference fundamental region Current fundamental region CONTINUUM MICROSTRUCTURE DESCRIPTION Materials Process Design and Control Laboratory
ONGOING WORK AT MPDC LAB Overall Goal: Development of fully autonomous system to classify and represent any microstructure affiliated with process sequencing • Representation and reconstruction using lower order descriptors • Extension to 3D microstructures (based on 3D feature parameters) • Automating descriptor selection for classification of different classes of microstructures based on stereology and efficiency studies • Classification of 2-D microstructures to 3-D structures with applications to micromechanicalmodeling • Exploring unsupervised and probabilistic classification techniques Lower order feature extraction Monte Carlo: single phase polyhedral Materials Process Design and Control Laboratory
S. Ganapathysubramanian and N. Zabaras, “Modeling the thermoelastic-viscoplastic response of polycrystals using a continuum representation over the orientation space”, Intl. J. Plasticity, accepted. S. Veeraraghavan and N. Zabaras, “A dynamic material library for the representation of single phase polyhedral microstructures”, Acta Materialia, submitted. INFORMATION RELEVANT PUBLICATIONS S. Acharjee and N. Zabaras, “A proper orthogonal decomposition approach to microstructure model reduction in Rodrigues’ space with applications to the control of material properties”, Acta Materialia 51, 5627—5646, 2003. CONTACT INFORMATION Prof. Nicholas Zabaras Materials Process Design and Control Laboratory Sibley School of Mechanical and Aerospace Engineering188 Frank H. T. Rhodes Hall Cornell University Ithaca, NY 14853-3801Email: zabaras@cornell.edu URL: http://www.mae.cornell.edu/zabaras/ Materials Process Design and Control Laboratory