
Correlation of NIR Hydrogen Lines with Black Hole Masses in Active Galaxies
E N D
Presentation Transcript
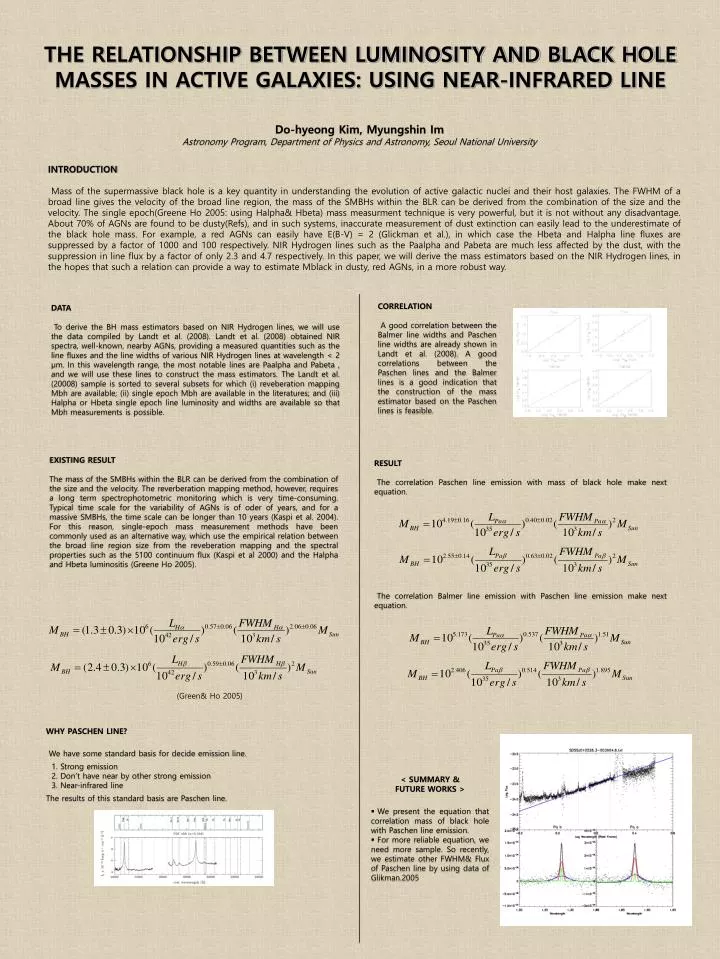
(Green& Ho 2005) THE RELATIONSHIP BETWEEN LUMINOSITY AND BLACK HOLE MASSES IN ACTIVE GALAXIES: USING NEAR-INFRARED LINE Do-hyeong Kim, Myungshin Im Astronomy Program, Department of Physics and Astronomy, Seoul National University INTRODUCTION Mass of the supermassive black hole is a key quantity in understanding the evolution of active galactic nuclei and their host galaxies. The FWHM of a broad line gives the velocity of the broad line region, the mass of the SMBHs within the BLR can be derived from the combination of the size and the velocity. The single epoch(Greene Ho 2005: using Halpha& Hbeta) mass measurment technique is very powerful, but it is not without any disadvantage. About 70% of AGNs are found to be dusty(Refs), and in such systems, inaccurate measurement of dust extinction can easily lead to the underestimate of the black hole mass. For example, a red AGNs can easily have E(B-V) = 2 (Glickman et al.), in which case the Hbeta and Halpha line fluxes are suppressed by a factor of 1000 and 100 respectively. NIR Hydrogen lines such as the Paalpha and Pabeta are much less affected by the dust, with the suppression in line flux by a factor of only 2.3 and 4.7 respectively. In this paper, we will derive the mass estimators based on the NIR Hydrogen lines, in the hopes that such a relation can provide a way to estimate Mblack in dusty, red AGNs, in a more robust way. CORRELATION A good correlation between the Balmer line widths and Paschen line widths are already shown in Landt et al. (2008). A good correlations between the Paschen lines and the Balmer lines is a good indication that the construction of the mass estimator based on the Paschen lines is feasible. DATA To derive the BH mass estimators based on NIR Hydrogen lines, we will use the data compiled by Landt et al. (2008). Landt et al. (2008) obtained NIR spectra, well-known, nearby AGNs, providing a measured quantities such as the line fluxes and the line widths of various NIR Hydrogen lines at wavelength < 2 μm. In this wavelength range, the most notable lines are Paalpha and Pabeta , and we will use these lines to construct the mass estimators. The Landt et al. (20008) sample is sorted to several subsets for which (i) reveberation mapping Mbh are available; (ii) single epoch Mbh are available in the literatures; and (iii) Halpha or Hbeta single epoch line luminosity and widths are available so that Mbh measurements is possible. EXISTING RESULT The mass of the SMBHs within the BLR can be derived from the combination of the size and the velocity. The reverberation mapping method, however, requires a long term spectrophotometric monitoring which is very time-consuming. Typical time scale for the variability of AGNs is of oder of years, and for a massive SMBHs, the time scale can be longer than 10 years (Kaspi et al. 2004). For this reason, single-epoch mass measurement methods have been commonly used as an alternative way, which use the empirical relation between the broad line region size from the reveberation mapping and the spectral properties such as the 5100 continuum flux (Kaspi et al 2000) and the Halpha and Hbeta luminositis (Greene Ho 2005). RESULT The correlation Paschen line emission with mass of black hole make next equation. The correlation Balmer line emission with Paschen line emission make next equation. WHY PASCHEN LINE? We have some standard basis for decide emission line. 1. Strong emission 2. Don’t have near by other strong emission 3. Near-infrared line The results of this standard basis are Paschen line. • < SUMMARY & • FUTURE WORKS > • We present the equation that correlation mass of black hole with Paschen line emission. • For more reliable equation, we need more sample. So recently, we estimate other FWHM& Flux of Paschen line by using data of Glikman.2005