Download
1 / 42
420 likes | 514 Views
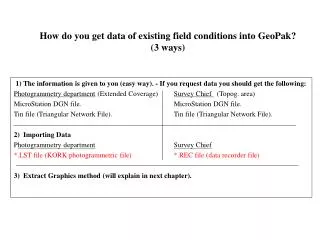
Explore how the USDA's National Agricultural Statistics Service leverages iPads for data collection in the June Area Survey. Learn about the survey process, challenges faced by field staff, solutions implemented, and results of GIS vs. farmer-reported acreage tests.

E N D
Field Data Collection Utilizing iPADson the USDA’s June Area Survey National Agricultural Statistics Service Presented by: Michael Gerling & Claire Boryan National Agricultural Statistics Service Presented by: Michael Gerling
Overview of June Area Survey • Annual survey that provides data on U.S. crops, livestock, grain storage capacity, and type and size of farm. • Comprised of designated land areas (segments). Each segment is about 640 acres(1 square mile). • 11,000 segments surveyed across the U.S.
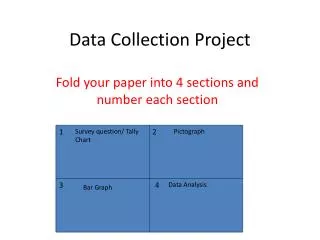
Overview of June Area Survey • Using a provided aerial photo, the interviewer divides segment into tracts representing unique land operating arrangements. • Interviewers screen for whether tract is part of a farm and collect crop and livestock information for each tract. • 42,000 Agricultural Tracts. • Paper questionnaire used to record data. A B 1 C 2 E D
Current Paper Version 24 or more pages. Shows one of two pages used to collect tract and field level information. Lots of rows and columns.
Permanent Area Frame ResearchGrid Sampling Laying a grid over the entire United States and sampling from this permanent frame.
Styluses Adonit Jot Pro Fine Point Stylus Ten One Design Pogo Sketch Stylus Wacom Tech Corp - Bamboo Stylus
Challenges for Field Staff CAPI iPADs Instrument 4. Grid Segments
Problems with Aerial Imagery (Zooming, Splitting, Overall Functionality)
Screen Visibility Problems (Glare, Sunlight, etc.) Enumeration late December – March 1st.
Respondent’s Acceptance of the Technology
Length of InterviewCompared to Paper Questionnaire Perception by Field Staff
Minimal Issues • Battery Life • Connectivity • Training Program: In–Person and Self-Paced/Remote Training • Complex Paper Questionnaire - dynamic logic transforms to a short CAPI form.
Challenges • Screen Visibility (Glare) • Weather Conditions – rain, snow, extreme temps. • Larger Screen wanted by field staff. • Speed – improve drawing out tracts and fields.
Possible Solutions – Eliminating Glare
Possible Solution for Rain/Snow Weather Conditions
2013 Consumer Electronic Show Panasonic unveils 20-inch Windows 8 Tablet
2013 - Test for differences in Farmer Reported Acres (June Area Survey) vs. Geographic Information Systems (GIS) Calculated Acres
Enumerators copied the tract and field information from the Aerial photo and into GIS instrument.
GIS Calculation vs. Farmer Reported (JAS) Acreage Test • Data with matching fields from (GIS) and JAS (farmer reported) contain 2,246 fields from 90 sampling segments from three states (PA, IN, WA). • Errors in data that could be traced prior to analysis of the fields in GIS were removed from the analysis. Any fields in which acreage is not reported in JAS or estimated in GIS were also removed. • There are 2,096 fields remaining once the above errors were removed
GIS vs. Farmer Reported Acreage Test • All Ag Tract fields • Interior Ag Tract fields • Exterior or Boundary Ag Tract fields • Permanent Pasture fields • Wooded fields
GIS vs. Farmer Reported (JAS) Segment Totals Acreage differences for all data and states individually.
P-values for Wilcoxon signed rank test to test acreage differences for segment totals • Tests the hypothesis that the mean (average) difference between GIRAFFE and JAS acreage estimation is equal to 0. • P-value < 0.1 = SLIGHT evidence that difference is NOT EQUAL to 0 • P-value < 0.05 = STRONG evidence that difference is NOT EQUAL to 0 • P-value < 0.01 = VERY STRONG evidence that difference is NOT EQUAL to 0 • Tests indicate that the mean difference is approximately 0 for all states (i.e., the difference between GIS and JAS acreage estimates is equal to 0 on average).
GIS vs. Farmer Reported (JAS) All Agricultural Fields Acreage differences for all agricultural fieldsand agricultural fields from each state.
Agricultural FieldsP-Values -Wilcoxon Signed Rank Test • Tests for difference in agricultural fields (fields in which area used for agriculture is greater than 0). • Tests indicate that acreage estimates are approximately equal on average.
Conclusion • Most tests resulted in the conclusion that the average difference in acreage estimates between GIS and JAS is approximately 0. • Exterior Ag fields showed that there was moderate statistical evidence (p value, 0.035) that the mean difference in GIS and JAS acreage estimates is different than 0. Especially in IN (p-value, 0.040). GIS appears to overestimate acreage based on plots of acreage difference.
Future……….. • Have Iowa Sate University (ISU) build the whole questionnaire and NASS port everything over to our servers, etc… • Take what we learned from this JAS-CAPI experience and build an in-house solution. • Work with ISU and update current JAS-CAPI to handle all states and build the rest of the questionnaire in EDR-CAPI. (Two window approach)
Contact Information • Michael Gerling michael.gerling@nass.usda.gov • Claire Boryan claire.boryan@nass.usda.gov