Download
1 / 44
480 likes | 1.03k Views
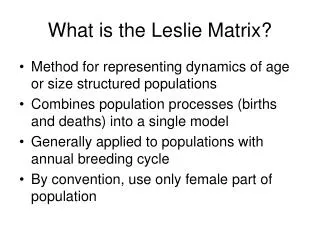
What is the Leslie Matrix?. Method for representing dynamics of age or size structured populations Combines population processes (births and deaths) into a single model Generally applied to populations with annual breeding cycle By convention, use only female part of population.

E N D
What is the Leslie Matrix? • Method for representing dynamics of age or size structured populations • Combines population processes (births and deaths) into a single model • Generally applied to populations with annual breeding cycle • By convention, use only female part of population
Setting up the Leslie Matrix • Concept of population vector • Births • Deaths
Population Vector N0 N1 N2 N3 …. Ns s+1 rows by 1 column (s+1) x 1 Where, s=maximum age
Births Newborns = (Number of age 1 females) times (Fecundity of age 1 females) plus (Number of age 2 females) times (Fecundity of age 2 females) plus ….. Note: fecundity here is defined as number of female offspring Also, the term “newborns” may be flexibly defined (e.g., as eggs, newly hatched fry, fry that survive past yolk sac stage, etc. N0 = N1F1 + N2F2 +N3F3 ….+FsNs
Mortality Number at age in next year = (Number at previous age in prior year) times (Survival from previous age to current age) Na,t = Na-1,t-1Sa Another way of putting this is, for age 1 for example: N1,t = N0,t-1S0-1 + N1,t-1 (0) + N2,t-1 (0) + N3,t-1 (0) + …
F0 F1 F2 F3 …. Fs S0 0 0 0 …. 0 0 S1 0 0 …. 0 0 0 S2 0 …. 0 …. 0 0 0 0 Ss-1 0 N0 N1 N2 N3 …. Ns N0 N1 N2 N3 …. Ns Leslie Matrix = (s+1) x 1 (s+1) x (s+1) (s+1) x 1
F0 F1 F2 F3 …. Fs S0 0 0 0 …. 0 0 S1 0 0 …. 0 0 0 S2 0 …. 0 …. 0 0 0 0 Ss-1 0 N0 N1 N2 N3 …. Ns N0 N1 N2 N3 …. Ns Leslie Matrix = s x 1 s x s s x 1
F0 F1 F2 F3 …. Fs S0 0 0 0 …. 0 0 S1 0 0 …. 0 0 0 S2 0 …. 0 …. 0 0 0 0 Ss-1 0 N0 N1 N2 N3 …. Ns N0 N1 N2 N3 …. Ns Leslie Matrix = Nt+1 = A Nt
Projection with the Leslie Matrix Nt+1 = ANt Nt+2 = AANt Nt+3 = AAANt Nt+4 = AAAANt Nt+n = AnNt
Properties of this Model • Age composition initially has an effect on population growth rate, but this disappears over time (ergodicity) • Over time, population generally approaches a stable age distribution • Population projection generally shows exponential growth
Properties of this ModelGraphical Illustration Lambda = Nt+1 / Nt Thus, Nt+1 = λ Nt
Projection with the Leslie Matrix Given that the population dynamics are ergodic, we really don’t even need to worry about the initial starting population vector. We can base our analysis on the matrix A itself Nt+n = AnNt
Projection with the Leslie Matrix Given the matrix A, we can compute it’s eigenvalues and eigenvectors, which correspond to population growth rate, stable age distribution, and reproductive value
Projection with the Leslie MatrixEigenvalues What’s an eigenvalue? Can’t really give you a “plain English” definition (heaven knows I’ve searched for one!) Mathematically, these are the roots of the characteristic equation (there are s+1 eigenvalues for the Leslie matrix), which basically means that these give us a single equation for the population growth over time
Projection with the Leslie MatrixCharacteristic Equation 1= F1λ-1 + P1F2λ-2 + P1P2F3λ-3 + P1P2P3F4λ-4 … Note that this is a polynomial, and thus can be solved to get several roots of the equation (some of which may be “imaginary”, that is have √-1 as part of their solution) The root (λ) that has the largest absolute value is the “dominant” eigenvalue and will determine population growth in the long run. The other eigenvalues will determine transient dynamics of the population.
Projection with the Leslie MatrixEigenvectors Associated with the dominant eigenvalue is two sets of eigenvectors The right eigenvectors comprise the stable age distribution The left eigenvectors comprise the reproductive value (We won’t worry how to compute this stuff in class – computing the eigenvalues and eigenvectors can be a bugger!)
Projecting vs. Forecasting or Prediction So far, I’ve used the term projecting – what does this mean in technical terms, and how does it differ from a forecast or prediction. Basically, forecasting or prediction focuses on short-term dynamics of the population, and thus on the transient dynamics. Projection refers to determining the long-term dynamics if things remained constant. Thus projection gives us a basis for comparing different matrices without worrying about transient dynamics.
Projecting vs. Forecasting or Prediction Simple (?) Analogy: The speedometer of a car gives you an instantaneous measure of a cars velocity. You can use to compare the velocity of two cars and indicate which one is going faster, at the moment. To predict where a car will be in one hour, we need more information, such as initial conditions: Where am I starting from? What is the road ahead like? etc. Thus, projections provide a basis for comparison, whereas forecasts are focusing on providing “accurate” predictions of the system’s dynamics.
Stage-structured ModelsLefkovitch Matrix Instead of using an age-structured approach, it may be more appropriate to use a stage or size-structured approach. Some organisms (e.g., many insects or plants) go through stages that are discrete. In other organisms, such as fish or trees, the size of the individual is more important than it’s age.
F0 F1 F2 F3 …. Fs T0-1 T1-1 T2-1 T3-1 ….. Ts-1 T0-2 T1-2 T2-2 T3-2 ….. Ts-2 T0-3 T1-3 T2-3 T3-3 ….. Ts-3 …. T0-s T1-s T2-s T3-s ….. Ts-s N0 N1 N2 N3 …. Ns N0 N1 N2 N3 …. Ns Lefkovitch Matrix Example =
Lefkovitch Matrix Note now that each of the matrix elements do not correspond simply to survival and fecundity, but rather to transition rates (probabilities) between stages. These transition rates depend in part on survival rate, but also on growth rates. Note also that there is the possibility for an organism to “regress” in stages (i.e., go to an earlier stage), whereas in the Leslie matrix, everyone gets older if they survive, and they only advance one age
F0 F1 F2 F3 …. Fs T0-1 T1-1 T2-1 T3-1 ….. Ts-1 T0-2 T1-2 T2-2 T3-2 ….. Ts-2 T0-3 T1-3 T2-3 T3-3 ….. Ts-3 …. T0-s T1-s T2-s T3-s ….. Ts-s N0 N1 N2 N3 …. Ns N0 N1 N2 N3 …. Ns Lefkovitch Matrix Example =
Example Application:Sustainable Fishing Mortality • An important question in fisheries management is “How much fishing pressure or mortality can a population support?”
F0 F1 F2 F3 …. Fs S0 0 0 0 …. 0 0 S1 0 0 …. 0 0 0 S2 0 …. 0 …. 0 0 0 0 Ss-1 0 N0 N1 N2 N3 …. Ns N0 N1 N2 N3 …. Ns Example Application:Sustainable Fishing Mortality =
Example Application:Sustainable Fishing Mortality S = e-(M+F) Knife-edge recruitment, meaning that fish at a given age are either not exposed to fishing mortality or are fully vulnerable
Example Application:Reproductive Strategy of Yellow Perch • One of main questions was whether “stunting”, meaning very slow growth, of yellow perch was caused by reproductive strategy or if reproductive strategy resulted from adaptation to low prey abundance • Our goal was to understand what stunted fish “should” do in terms of age at maturity
Reproductive Strategy of Yellow Perch • Basic model had a number of assumptions • Energy intake is limited and depends on size of fish • Yellow perch show an ontogenetic shift in diet where indivduals less than 10 grams eat zooplankton, individuals 10 to 30 grams eat benthic invertebrates, and individuals larger than 30 grams eat fish • Net energy intake can only be partitioned to growth or reproduction • Reproduction is all or nothing • Reproduction may have “survival costs (theta)”