Download
1 / 34
340 likes | 406 Views
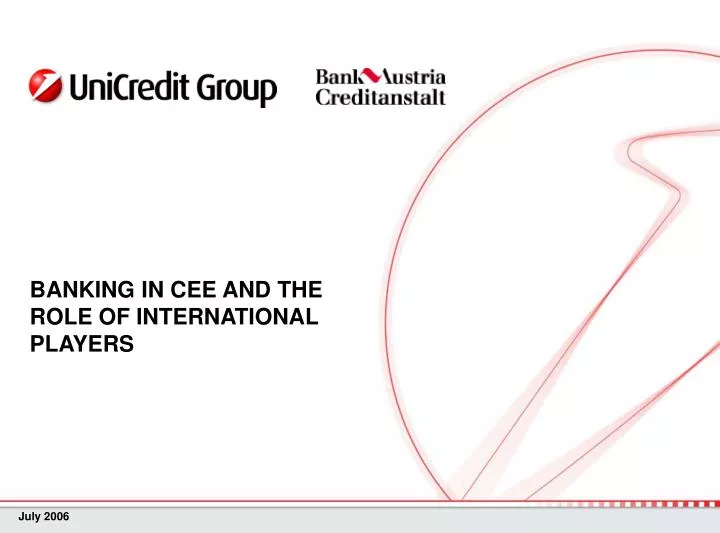
BANKING IN CEE AND THE ROLE OF INTERNATIONAL PLAYERS. July 2006. EXECUTIVE SUMMARY.

E N D
BANKING IN CEE AND THE ROLE OF INTERNATIONAL PLAYERS July 2006
EXECUTIVE SUMMARY • All around the CEE region, the banking sector is characterised by widespread relevance of foreign capital. A limited number of international players considers the region as a second home market. Such international players are among the top players in several countries of the region and profit from a widespread cross-regional network. • While structural transformation is almost completed in most of the traditional destinations, additional markets are gradually opening and represent the new opportunity for international players. In particular, we view Russia, Turkey, Ukraine as the new frontiers of a regional strategy. The consolidation process at the international level represents another significant driver for structural transformation in the region, like in the case of the UniCredit-HVB merger, which brought to the creation of the by far largest player at the regional level and to a renewed process of consolidation at the single country level. • The CEE region represents a fast growing market of more than 1,000 billion euro of total banking assets, with still bright prospects for growth, given the persistently favourable macroeconomic environment and relative under-penetration compared to Eurozone countries • Loans financial deepening is increasing, fuelled by both demand and supply factors, resulting in a significant increase of loans over GDP ratio from 24% to 32% in the 2000-2005 period (CEE12). Lending growth has been particularly fast in SEE countries and Russia followed by Turkey.Fast lending expansion is expected to continue, driven by the retail segmentand sustained by favourable corporate lending performance. The fastest dynamic is expected in Russia, Serbia, Turkey and Romania. • Increasing financial deepening on the lending side has been accompanied by substantially stable pattern in deposits. In the years to come, acceleration of investment activities and portfolio diversification are expected to lead to a reduction in the deposit over GDP ratio in Central Europe (Poland, the Czech R., Hungary, Croatia and Slovakia) while still a good dynamic is expected in the rest of the region • Overall, the banking profitability outlook remains positive
AGENDA Evolution of banking systems in CEE Presence and ranking of international banking groups in the region Relevance and positioning of international players at single country level
MORE THAN 1,000 € BLN MARKET IN TERMS OF TOTAL ASSETS, WITH LARGELY INTERNATIONAL BANKS AND STILL IMPORTANT GROWTH OPPORTUNITIES (1) Including commercial and savings banks, foreign bank branches while excl. cooperatives; (2) Based on unconsolidated figures unless otherwise stated; market shares are based on net assets figures according to local accounting standards; (3) Figures are expressed as net values unless otherwise stated; (4) As of Q3 2005; (5) Based on gross assets; (6) As of 2004; (7) Gross figures; (8) Based on share capital of Lithuanian Banks owned by foreign investors; (9) Based on IAS results; (10) Including BCR; (11) Including HVB Tiriac & UCR proforma; (12) Excluding OFIs; (13) Data refer to Rep of Srpska; (14) For Hypo Alpe Adria, market share based on Group’s results; (15) Excluding non-bank credit organisations; (16) Based on net figures; (17) Excluding Ukraine; (18) Unweighted average Sources: local Central Banks, ECB, Banking Associations and Supervisory Authorities and Unicredit-NE Research Network (i) All banking systems’ figures converted using eop exchange rates vs €; nominal GDP converted using avg exchange rates
DEMAND AND SUPPLY FACTORS (BOTH STRUCTURAL AND CYCLICAL) BEHIND LENDING GROWTH Evolution of banking loans in CEE-12(1) (% of GDP) Total loans’ volumes growth(2) (2000 =100, in € terms) CAGR ’00-’08 Russia 39% p.a. SEE 21% p.a. Turkey 12% p.a. CE 12% p.a. Sources: Unicredit-NE Research Network based on local Central Banks’ data (1) Including Poland, Czech R., Hungary, Slovakia, Slovenia, Romania, Bulgaria, Croatia, Bosnia-Herzegovina, Serbia, Russia and Turkey; excl. Ukraine and the baltics; (2)Total loans include general govt, non-financial corporations and retail and where available non-profit institutions serving households (NPISHs) and Non-MFIs
TWO DIGITS LENDING GROWTH LEADING TO FAST INCREASES IN BANKING PENETRATION ON THE ASSETS SIDE (+2.7% OF GDP ON AVERAGE PER YEAR), HOWEVER WITH STRONG CROSS COUNTRIES DIFFERENCES Evolution of banking loans1 by country (% of GDP) Sources: Unicredit-NE Research Network based on local Central Banks’ data (1) Total loans include general govt, non-financial corporations, households and where available NPISHs and Non-MFIs
RETAIL LENDING TO REMAIN THE MAIN DRIVER OF VOLUMES GROWTH, WITH GOOD MACRO PROSPECTS SUPPORTING A FAVOURABLE CORPORATE LENDING PERFORMANCE Expected evolution of retail loans1 (CAGR ’05-’08, local currency) Expected evolution of corporate loans (CAGR ’05-’08, local currency) Sources: Unicredit-NE Research Network based on local Central Banks’ data (1) Including households and (when available) NPISHs
RELATIVELY STABLE BANKING PENETRATION ON THE LIABILITIES SIDE, … Evolution of banking deposits in CEE-12(1) (% of GDP) Total deposits’ volumes growth(2) (2000 =100, in € terms) CAGR ’00-’08 Russia 32% p.a. SEE 17% p.a. Turkey 11% p.a. CE 9% p.a. Sources: Unicredit-NE Research Network based on local Central Banks’ data (1) Including Poland, Czech R., Hungary, Slovakia, Slovenia, Romania, Bulgaria, Croatia, Bosnia-Herzegovina, Serbia, Russia and Turkey; excluding Ukraine and the baltics; (2) Total deposits include general govt, non-financial corporations, households and when available NPISHs and Non-MFIs
… WITH DIFFERENT PATTERNS AMONG COUNTRIES Evolution of banking deposits by country (% of GDP)1 Sources: Unicredit-NE Research Network based on local Central Banks’ data (1) Total deposits include general govt, non-financial corporations, households and where available NPISHs and Non-MFIs
GOOD PROFITABILITY OF THE CORPORATE SECTOR EXPECTED TO SUSTAIN GROWTH IN DEPOSITS’ VOLUMES AT THE REGIONAL LEVEL WITH RETAIL PLAYING A SIGNIFICANT ROLE IN RUSSIA, ROMANIA, BULGARIA, SERBIA, BOSNIA AND TURKEY Expected evolution of retail deposits1 (CAGR ’05-’08, local currency) Expected evolution of corporate deposits (CAGR ’05-’08, local currency) Sources: Unicredit-NE Research Network based on local Central Banks’ data (1) Including households and (when available) NPISHs
WE EXPECT THE REGION TO CONTINUE TO DELIVER GOOD RESULTS IN TERMS OF BANKING PROFITABILITY NET PROFITS Before tax / extr items CAGR 2005-08: +15.2% € bn €32.0bn €28.4bn €25.4bn €21.0bn €16.5bn % country over CEE-9 NetProfit(1) (2005) Sources: Central Banks and Unicredit-NE Research Network (1)Net Profit for the Banking Sector is before tax and extraordinary items.
AGENDA Evolution of banking systems in CEE Presence and ranking of international banking groups in the region Relevance and positioning of international players at single country level
A SMALL NUMBERS OF INTERNATIONAL PLAYERS DOMINATING THE MARKET WITH ROUGHTLY 26% MARKET SHARE IN TERMS OF ASSETS… Proforma 2005, as of perimeter May 2006i Consol. Assets (€ bln)i Total Revenues (€ mln) Net Profit before min.int. (€ mln)ii Countries of presenceiii Unicredit (2) Erste 48.7(4) 6(4) (3) (3) (3) 2,406(4) 711(4) KBC RZB (6) 42.3(5) 2,026(5) 481(5) SocGen 30.1(7) 1,551(7) 10(7) 531(7) Intesa (8) (8) (8) 22.1(9) 1,212(9)(10) 326(9) 9(9) OTP 19.1(11) 1,561(11) 609(11) 6(11) • Excluding Splitska Banka, Vienna Profit Center and other UCI’s minorities (Unicredit Securities&Unicredit leasing BG) while including proforma Nova Banjalucka Banka (full year), Hypo Stavebni Sporitelna and 50% of KFS-Yapi combined entity (full 2005 normalised for Yapi); BankTiriac, Hebros and Eksimbanka consolidated proforma for the full year; (2) Including Azerbaijan; (3) Including proforma Erste Serbia; (4) Including proforma BCR; (5) Including proforma Impexbank; Bank Aval fully consolidated since 1st Oct 2005; (6) Excluding Kosovo; (7) Including proforma Splitska Banka; (8) Including proforma KMB and Intesa Beograd; (9) Including proforma Ukrsotsbank and UPI Banka (as of Sep ’05); (10) Revenues for KMB and UPI Banka n.a.; (11) Including proforma Niska Banka and Zepter Banka; profits are before tax; P&L of OTP Hrvatska doesn’t include Q1 2005 • Source: Unicredit-NE Research Network; numbers converted using avg and eop ex. rates from UIC for P&L and BL figures, respectively • (i) 100% of total assets, revenues and profit after tax (before min.interests) for controlled Companies (stake > 50%) and share owned for non controlled companies; proforma results include also banks acquired during 2005 and 2006; • After tax, before minority interest • Including direct and indirect presence in the 21 CEE countries, excluding representative offices
INTERNATIONAL PLAYERS PREVAIL ALL OVER THE REGION WITH STRUCTURAL TRANSFORMATION STILL ONGOING IN RUSSIA, TURKEY AND SLOVENIA CEE Total assets2 by ownership, 2005* Market share of foreign-owned banks1 (% of total banking system assets, 2005) *Excl. Russia and Turkey foreign ownership 78% • Sources: Unicredit-NE Research Network based on local Central Banks’ data • (1) For Czech R. and Slovenia figures refer to end of 2004; for Lithuania, figures refer to share capital of Lithuanian Banks owned by foreign investors; the ratio is computed considering 100% of assets when shareholding > 50% • Excluding Ukraine; • Including total assets controlled by non-residents with less than 50% of management rights
… AND STRONG FINANCIAL PENETRATION AND CEE FRANCHISE WITH AROUND 12,000 BRANCHES AND 230,000 EMPLOYEES Proforma 2005, as of perimeter May 2006i Branches Employees (ths) Loans+Deposits (€ bln)ii UniCredit 2,956(1) 65.0(1) 99.7(1) Erste 32.2(2) 55.3(2) 1,668(2) KBC 1,237 28.6 46.1 RZB 48.7(3) 51.1(3) 2,633(3) SocGen 1,027(4) 16.7(4) 34.5(4) Intesa 24.9(5) 1,286(5) 27.1(5) OTP 1,000(6) 14.7(6)(7) 22.1(6) • Excluding Splitska Banka while including Nova Banjalucka Banka, Eksimbanka (employees as of Sep ’05) and 100% of KFS-Yapi branches and employees; including Splitska, branches and employees would be 3,068and 66.3 ths, respectively; figures as of dec 2005 recasted end of March; figures for loans and deposits do not include Vienna Profit Center; (2) Including proforma BCR and Erste Bank Serbia; (3) Including proforma Impexbank; (4) Including proforma Splitska banka; employees of SG Yugoslav bank n.a. (5) Including proforma KMB, Intesa Beograd, Ukrsotsbank and UPI banka; (6) Including proforma Niska banka, Zepter banka and OTP Hrvatska; (7) Employees of Zepter banka n.a. • Source: Unicredit-NE Research Network • 100% of branches (excluding representative offices) and employees; for Unicredit, figures on employees are FTE; • Only loans/deposits to/from customers (excluding amounts to/from banks); figures for loans are net values
INTERNATIONAL PLAYERS IN THE FIELD WITH DIFFERENT BACKGROUND AND MARKET APPROACH Perimeter as of May 2006 PL TK HR CZ RU BG HU RO SK BiH SI FRY(1) UA AL AJ(2) KZ(3) MK BY(4) BLT(5) UNICREDIT R ERSTE KBC M RZB M R(6) SOCGEN I R R R INTESA R R I I OTP CITIGROUP Among the top 5 banks in the country in terms of total assets Representative Office Indirect presence Minority stake Presence R I M Note: (1) Serbia & Montenegro (2) Azerbaijan (3) Kazakhstan (4) Belarus; (5) Estonia, Latvia and Lithuania; (6) Lithuania Source: Banks’ Annual Report and Investor Relations
STRATEGIC POSITIONING OF INTERNATIONAL GROUPS IN THE CEE REGION – FOCUSED VS WIDESPREAD STRATEGY Strategic positioning: country of operation and size in each market (size = total assets controlled in the region) Number of Top 5 Number of countries of active presence(i) Source: Unicredit-NE Research Network (i) Including both direct and indirect presence
AGENDA Evolution of banking systems in CEE Presence and ranking of international banking groups in the region Relevance and positioning of international players at single country level
TOP BANKS IN BOSNIA & HERZEGOVINA Total Assets1, market share and ownership Total Assets LAS (€bn) Market share2 Majority shareholder (3) 25% (Unicredit Group) 21% (Raiffeisen International) 13% (Unicredit Group) (3) 12% (Unicredit Group) 11% (Hypo Alpe-Adria-Group) 8% (Hypo Alpe-Adria-Group) 4% (Intesa Group) • Source: Unicredit-NE Research Network based on local banks’ financial statements and press releases • Total assets according to local accounting standards based on unconsolidated results; for Nova Banjalucka Banka (NBB) figures are according to IFRS and expressed as gross values thus the overall market share may be overestimated due to the different standard • Based on net unconsolidated figures for total banking system’s assets according to local accounting standards; • Including proforma Nova Banjalucka Banka
TOP BANKS IN CROATIA Total Assets1, market share and ownership Total Assets LAS (€bn) Market share2 Majority shareholder 24% (Unicredit Group) 18% (Intesa Group) 12% (Erste Group) 11% (Raiffeisen International) 9% (Unicredit Group until June ’06 Société Générale Group as of July) 7% (Hypo Alpe-Adria-Group) 3% (OTP Group) 3% (Hypo Alpe-Adria-Group) • Source: Unicredit-NE Research Network based on Banka Magazine figures • Total assets according to local accounting standards based on unconsolidated results; • Based on net unconsolidated figures for total banking system’s assets according to local accounting standards
TOP BANKS IN BULGARIA Total Assets1, market share and ownership Total Assets IAS (€bn) Market share2 Majority shareholder 21% (Unicredit Group) 14% (OTP Group) 11% (Unicredit Group) 10% (Unicredit Group) 10% (NBG) 9% (Raiffeisen International) 8% (Majority private capital) 5% (EFG Eurobank) • Source: Unicredit-NE Research Network based on local banks’ financial statements and BNB • Total assets according to international accounting standards based on consolidated results; for DSK bank, figures are according to hungarian IAS • Based on net unconsolidated figures for total banking system’s assets according to international accounting standards;
TOP BANKS IN ESTONIA Total Assets1, market share and ownership Total Assets IAS (€bn) Market share2 Majority shareholder 59% (Swedbank) 21% (SEB) ~9% (Nordea Group) (Sampo Group) 8% 2% (Latvian Business Bank) 0.3% (Majority private local capital) • Source: Unicredit-NE Research Network based on local banks’ financial statements and Central Bank • Total assets according to international accounting standards based on unconsolidated results; for Nordea Bank figures are consolidated and thus overall market share may be overestimated due to different standard • Based on net unconsolidated figures for total banking system according to international accounting standards
TOP BANKS IN THE CZECH REPUBLIC Total Assets1, market share and ownership Total Assets IAS (€bn) Market share2 Majority shareholder (KBC Group) 25% (Erste Group) 22% (Société Générale Group) 17% (Unicredit Group) 7% 6% (Unicredit Group) 4% (Commerzbank) 3% (Raiffeisen International) • Source: Unicredit-NE Research Network based on local banks’ financial statements and CNB • Total assets according to international accounting standards based on consolidated results (except for Commerzbank whose figures are unconsolidated according to local accounting standards; • Based on net unconsolidated figures for total banking system’s assets according to local accounting standards
TOP BANKS IN HUNGARY Total Assets1, market share and ownership Total Assets LAS (€bn) Market share2 Majority shareholder (Majority foreign capital) 19% (KBC Group) 10% 9% (Bayerische Landesbank) 8% (Intesa Group) 8% (Erste Group) (Raiffeisen International) 7% 5% (Unicredit Group) • Source: Unicredit-NE Research Network based on local banks’ financial statements and MNB • Total assets according to local accounting standards based on unconsolidated results; • Based on net unconsolidated figures for total banking system’s assets according to local accounting standards
TOP BANKS IN LATVIA Total Assets1, market share and ownership Total Assets IAS (€bn) Market share2 Majority shareholder (Swedbank) 20% (SEB) 17% (Majority private local capital) 17% (DnB Nord Bank ASA) 7% (Majority private capital) 6% 5% (Nordea Group) • Source: Unicredit-NE Research Network based on local banks’ financial statements and Central Bank • Total assets according to international accounting standards based on consolidated results; • Based on gross unconsolidated figures for total banking system’s assets according to local accounting standards
TOP BANKS IN LITHUANIA Total Assets1, market share and ownership Total Assets IAS (€bn) Market share2 Majority shareholder (SEB) 34% 27% (Swedbank) 12% (DnB Nord Bank ASA) 10% (Conversgroup - LUX) 7% (Sampo Bank Plc.) 6% (Nordea) • Source: Unicredit-NE Research Network based on local banks’ financial statements and Central Bank • Total assets according to international accounting standards based on consolidated results; • Based on net unconsolidated figures for total banking system’s assets according to local accounting standards
TOP BANKS IN POLAND Total Assets1, market share and ownership Total Assets IAS (€bn) Market share2 Majority shareholder (Unicredit Group) 20% (State) 16% (Unicredit Group) 11% (Unicredit Group) 10% (ING Group) 7% (Commerzbank) 6% (CitiGroup) 6% 5% (AIB Ltd) • Source: Unicredit-NE Research Network • Total assets according to international accounting standards based on consolidated results; • Based on net unconsolidated figures for total banking system’s assets according to local accounting standards
TOP BANKS IN RUSSIA Total Assets1, market share and ownership Total Assets LAS (€bn) Market share2 Majority shareholder (State) 26% (State) 6% 4% (Gazprom – State3) 2% (Majority private local capital) 2% (Majority private local capital) 2% (Moscow City Government) 2% (Private local capital) • Source: Unicredit-NE Research Network based on Interfax Rating Agency • Total assets according to local accounting standards based on unconsolidated results; • Based on gross figures for total banking system’s assets; • (3) In the end of 2005 Dresdner bank acquired ~33% stake
TOP BANKS IN SLOVAKIA Total Assets1, market share and ownership Total Assets IAS (€bn) Market share2 Majority shareholder (Erste Group) 18% (Intesa Group) 16% (Raiffeisen International) 13% (KBC Group) 13% 9% (Unicredit Group) (ING Group) 7% 5% (Unicredit Group) 4% (Unicredit Group) • Source: Unicredit-NE Research Network based on local banks’ financial statements and NBS • Total assets according to international accounting standards based on consolidated results except for ING (unconsolidated and LAC) and CSOB (unconsolidated); • Based on total banking system’s assets according to harmonised statistics (IAS)
TOP BANKS IN ROMANIA Total Assets1, market share and ownership Total Assets LAS (€bn) Market share2 Majority shareholder 26% (Erste Group) (Société Générale Group) 15% (Unicredit Group) 9% 9% (Raiffeisen International) 7% (Unicredit Group) 5% (ING Group) 4% (EFG Eurobank) 4% (State) • Source: Unicredit-NE Research Network based on local banks’ financial statements and BNR • Total assets according to local accounting standards based on unconsolidated results; • Based on unconsolidated net figures for total banking system’s assets according to local accounting standards
TOP BANKS IN SLOVENIA Total Assets1, market share and ownership Total Assets LAS (€bn) Market share2 Majority shareholder 31% (State & KBC) (State) 10% (Majority private local capital) 9% (Société Générale Group) 7% (Unicredit Group) 6% (SanPaolo IMI Group) 6% (Nova Ljubljanska banka) 6% • Source: Unicredit-NE Research Network based on local banks’ financial statements and Central Bank • Total assets according to local accounting standards based on unconsolidated results; • Based on net unconsolidated figures for the total banking system’s assets according to local accounting standards
TOP BANKS IN SERBIA AND MONTENEGRO Total Assets1, market share and ownership Total Assets IAS (€bn) Market share2 Majority shareholder 16% (Raiffeisen International) 11% (Intesa Group) 10% (State) 9% (Hypo Alpe-Adria-Group) (Unicredit Group/BA-CA) 6% 5% (State) • Source: Unicredit-NE Research Network based on local banks’ financial statements and NBS • Total assets according to international accounting standards based on consolidated results; • Based on net unconsolidated assets for the overall banking system according to local accounting standards
TOP BANKS IN TURKEY Total Assets1, market share and ownership Market share2 Total Assets LAS (€bn) Majority shareholder (State) 16% (IsBank Pension fund) 16% (Sabanci Group) 13% (Unicredit & Koc Group) 10% (Doğuş Group & GE) 9% 8% (State) 7% (State) 6% (Unicredit & Koc Group) 4% (Unicredit & Koc Group) • Source: Unicredit-NE Research Network based on Bankers’ Association figures and BRSA • Total assets according to local accounting standards based on unconsolidated results; for the Koc-YKB combined entity figures refer to proforma results including only Q4 of YKB P&L data; • Based on net unconsolidated figures for total banking system’s assets according to local accounting standards
METHODOLOGY • The comparison covers the following 16 countries: Bosnia and Herzegovina, Bulgaria, Croatia, Czech Republic, Estonia, Hungary, Latvia, Lithuania, Poland, Romania, Russia, Serbia and Montenegro, Slovakia, Slovenia,Ukraine and Turkey; • In the ranking of international players, the CEE region includes the above mentioned 16 countries plus Albania, Azerbaijan, Belarus, Kazakhstan and Macedonia; • Banking results’ in the first part of the comparison (up to slide 17) are according to local IAS (with the exception of SKB and SG Vostok – owned by SocGen – UPI Banka – owned by Intesa – Niska Banka and Zepter Banka – owned by OTP – in local accounting standards). For Erste Bank Croatia and RZB figures are according to austrian IAS while for OTP according to hungarian IAS and may thus slightly differ from the local IAS; • Data are proforma 12M including deals closed as of May 2006. Only in a few cases proforma 12M results are not available (for details see notes on the slides); • Data refer to consolidated results of the bank (with the exception of OTP Hungary); • Data correspond to the sum of stand-alone results of CEE subsidiaries considering 100% of total assets, revenues and net profits (after tax and before minority interests) if shareholding > 50%. If < 50%, figures are shown proquota; for employees and branches, we consider 100%; only for RZB figures refer to overall results of Raiffeisen international as no data were available for most of its subsidiaries. This implies some underestimation of 2005 performance given that some banks are not fully owned (i.e. Tatra Banka, Priorbank, Raiffeisen Croatia, Raiffeisen Czech R., Raiffeisen Hungary, Raiffeisen Serbia, Raiffeisen Bosnia and Raiffeisen Krekova Banka); • Figures may differ from those published in Groups’ results due to differences in the accounting standards (local vs home country ones), number of quarters consolidated (as we include where available full year results) and consolidation effects; • The comparison among top banks at single country level (from slide 18) is based on a variety of different data which not always correspond to international accounting standards. Moreover, results will be/were published in individual countries only after this report was prepared. Market shares have been calculated based on data reported to the national banks on unconsolidated basis and according to LAS. Therefore in some countries (Bulgaria, Czech R., Latvia, Lithuania, Poland, Serbia and Slovakia) the numerator and the denominator do not have the same delineation and may thus overestimate the overall size of each bank in the market. The comparison nonetheless gives a picture of the relative sizes and trends in the single banking markets of the region. • Closing date Mid June 2006