Download
1 / 20
230 likes | 976 Views
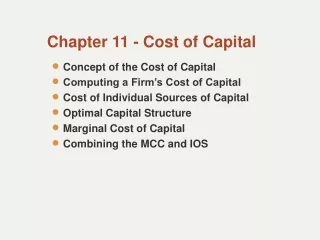
Chapter 11 - Cost of Capital. Concept of the Cost of Capital Computing a Firm’s Cost of Capital Cost of Individual Sources of Capital Optimal Capital Structure Marginal Cost of Capital Combining the MCC and IOS . Concept of the Cost of Capital.

E N D
Chapter 11 - Cost of Capital • Concept of the Cost of Capital • Computing a Firm’s Cost of Capital • Cost of Individual Sources of Capital • Optimal Capital Structure • Marginal Cost of Capital • Combining the MCC and IOS
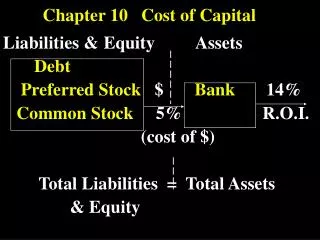
Concept of the Cost of Capital • When a firm invests money in a project, it should earn at least as much as it cost the firm to acquire the funds. Therefore, the cost of capital may be defined as the minimum acceptable rate of return. • The term “cost of capital” has also been referred to as the firm’s required rate of return, the hurdle rate, and the opportunity cost.
Computing a Firm’s Cost of Capital • Weighted Cost of Capital: • For a given amount of investment capital to be raised, the cost of capital is a weighted average of the after-tax costs of the individual sources of financing. • Example:Assume a firm wishes to raise $10 million using 40% debt, 10% preferred stock, and 50% common equity financing. Given the following, calculate the firm’s cost of capital. Source of FinancingAfter-Tax CostWeight Debt 8% .4 Preferred Stock 10% .1 Common Equity 14% .5 Weighted Average Cost of Capital: .4(8%) + .1(10%) + .5(14%) = 11.2%
Computing a Firm’s Cost of Capital (Continued) • Questions to be Addressed: • 1. What are the costs of the individual sources of capital? • 2. What set of weights (i.e., the capital structure) is appropriate? • 3. What is the relationship between the cost of capital and the amount of investment capital to be raised?
Cost of Individual Sources of Capital • Cost of Debt (kd) Note:Flotation costs on new debt (if any) have been ignored since the majority of debt is privately placed and has no flotation cost. If, however, bonds are publicly placed and involve flotation costs, an adjustment could be made to the before-tax cost of debt.
Cost of Individual Sources (Continued) • Cost of Preferred Stock (kp):
Using the Constant Growth in Dividends Model to Estimate the Cost of Common Equity • Cost of Common Equity: • The rate of return required by the firm’s common stockholders. An opportunity cost concept (i.e., what rate of return could the stockholders earn if they invested the funds in other alternatives of comparable risk.) An extremely difficult number to estimate. • Cost of Retained Earnings(ke):
Cost of New Common Stock (kn): (Using the constant growth in dividends model) Note: If it were not for flotation costs, the cost of newly issued common stock would be equal to the cost of retained earnings. (They are both sources of common equity).
Using the Capital Asset Pricing Model (CAPM) to Estimate the Cost of Common Equity • where: • Rf = risk-free rate of return • Km = required return on the market • b = beta coefficient
Beta Coefficient(Measure of Market Risk) • The extent to which the returns on a given asset move with the overall market Higher betas mean greater risk. For example, a beta of 2.0 indicates that an asset’s return should increase 2% for every 1% increase in the market. Conversely, the asset’s return should decrease 2% for every 1% decrease in the market.
The CAPM ke Rf The Market b
Optimal Capital Structure • What is the appropriate combination of debt and equity? If a firm were 100% equity financed (debt ratio = 0), financial risk would be zero (only business risk would exist), and the weighted average cost of capital (ka) would be equal to the cost of equity (ke). Initially, the use of debt may reduce (ka) as a lower cost of debt is combined with a higher cost of equity. Beyond some point, however, as added financial risk drives up both the cost of debt and the cost of equity, (ka) will increase. • Problem: At what level of financial leverage will (ka) be minimized?
Cost of Capital ke ka kd Debt/Asset Ratio
Stock Price Debt/Asset Ratio
Expected EPS Debt/Asset Ratio
Marginal Cost of Capital (MCC) • MCC is the cost of obtaining an additional dollar of new capital. If, during a given period of time, a firm tries to raise more and more capital, a higher cost of capital may result. Whenever any of the costs of the individual sources increase, the weighted average cost of capital (ka) must be recalculated to reflect the cost of obtaining additional capital (MCC).
Marginal Cost of Capital (MCC)(Continued) • To develop a MCC schedule, all break points must be determined, and at each point ka must be recalculated. • A break point is a level of financing at which ka increases because one of the individual costs increased. • In the example that follows only retained earnings break points will be illustrated. In practice, however, changes in the costs of all components (e.g., debt, preferred stock) must be taken into account.
MCC Schedule MCC Break Point ka2 ka1 Amount of New Capital ($ millions)
Combining the MCC and Investment Opportunities Schedule (IOS) • A firm should continue to invest funds as long as the rates of return received on the investments exceed the firm’s cost of acquiring the investment capital. In the following graph the firm should accept projects A and B, and reject project C. The point of intersection determines the firm’s optimal capital budget, and the firm’s cost of capital for its average risk projects.
MCC and IOS Schedules Percent A B MCC C IOS Amount of New Capital ($ millions)