Tiernan Erickson U.S. Census Bureau
310 likes | 519 Views
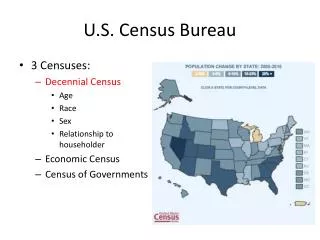
Using a Cellular Automata Urban Growth Model to Estimate the Completeness of an Aggregated Road Dataset. Tiernan Erickson U.S. Census Bureau. Background. Address Canvassing: Census workers compare what they see on the ground to what is shown on the Census Bureau's address list.

Tiernan Erickson U.S. Census Bureau
E N D
Presentation Transcript
Using a Cellular Automata Urban Growth Model to Estimate the Completeness of an Aggregated Road Dataset Tiernan Erickson U.S. Census Bureau
Background Address Canvassing: • Census workers compare what they see on the ground to what is shown on the Census Bureau's address list. • Based on their findings, the census workers will verify, update, or delete addresses already on the list, and add addresses that are missing from the list. • At the same time, they will also update maps so they accurately reflect what is on the ground. • Housing unit addresses verified: 145 million • Census workers hired for address canvassing: 140,000 Source: U.S. Census Bureau. Address Canvassing Facts/Statistics. Retrieved June 16, 2012, from http://2010.census.gov/ news/press-kits/one-year-out/address-canvasing/ address-canvassing-facts-statistics.html
Background Geographic Support System (GSS) Initiative: • Integrated program in support of the 2020 Census: • Improved address coverage • Continual spatial feature updates • Enhanced quality assessment and measurement • A targeted, rather than full, address canvassing operation during 2019 in preparation for the 2020 Census. • Collaboration with federal, state, local, and tribal governments and other key stakeholders to establish an acceptable address list for each geographic entity. Source: U.S. Census Bureau. Geographic Support System (GSS) Initiative. Retrieved June 16, 2012, from http://www.census.gov/geo/www/gss/index.html
Background Geographic Support System (GSS) Initiative: • Positional Accuracy • Thematic Accuracy • Temporal Accuracy • Logical Consistency Completeness?
Spatial Data Completeness Detroit, MI Source: Google Maps
Spatial Data Completeness South of Austin, TX Source: Google Maps
Urban Growth Forecasting Models Source: Project Gigalopolis http://www.ncgia.ucsb.edu/projects/gig/v2/About/abImages/apps/wash-balt_1792-2100.htm 8
Urban Growth Forecasting Models Cellular Automata Urban Growth Models • Generate realistic urban patterns • Integrate the modeling of the spatial and temporal dimensions of urban processes. -Santé, et al. (2010) Image Source: Cutsinger (2006) 9
SLEUTH Model S - Slope L - Landuse E - Exclusion U - Urban Extent T - Transportation H - Hillshade 11
SLEUTH Model S - Slope L - Landuse E - Exclusion U - Urban Extent T - Transportation H - Hillshade 12
SLEUTH Model S - Slope L - Landuse E - Exclusion U - Urban Extent T - Transportation H - Hillshade 13
SLEUTH Model S - Slope L - Landuse E - Exclusion U - Urban Extent T - Transportation H - Hillshade 14
SLEUTH Model S - Slope L - Landuse E - Exclusion U - Urban Extent T - Transportation H - Hillshade 15
SLEUTH Model S - Slope L - Landuse E - Exclusion U - Urban Extent T - Transportation H - Hillshade 16
SLEUTH Model SLEUTH Model Model Parameters (“Urban DNA”): • Diffusion • Breed • Spread • Slope Resistance • Road Gravity
SLEUTH Model Source: Clarke et al. (1997)
SLEUTH Model Source: Clarke et al. (1997)
SLEUTH Model Source: Project Gigalopolis http://www.ncgia.ucsb.edu/projects/gig/v2/About/abImages/apps/wash-balt_1792-2100.htm 20
SLEUTH-3r • More efficient • Jantz et al. (2009) • Used to model entire Chesapeake Bay drainage • Uses different measures of “fit” to compare prediction with actual for calibration and validation • SLEUTH and SLEUTH-3r are free and run on Unix (Cygwin) • Requires 1.5G RAM
Methods • Use SLEUTH-3r • NLCD available for 1992, 2001, and 2006. • Calibration: • 1992 – 2001 • Prediction: • 2006(est.) • Validation: • 2006(est.) vs. 2006 (actual)
Methods 23
Expected Project Output • SLEUTH's Output: • Series of rasters showing percent likelihood of new development for each cell, for each year between 2001 and 2006 Research Product: • Aggregate prediction values to the tract level. • For each tract last updated more than a year previous to 2006, the percent-likelihood of development will be summed for each year since last updated. • If the sum total of unaccounted-for growth is above a threshold, then the tract is in need of updating. 24
Significance Estimate of completeness of aggregated road dataset (TIGER) Incomplete in areas where: Road growth is occurring rapidly, and Have not been updated recently • Complete (save resources) in areas where: • Little or no growth, or • Have been updated recently 25
Limitations • SLEUTH does not get into the causes of urban growth (as inputs). • Instead, focuses on measuring and predicting a region's growth pattern ("Urban DNA") regardless of underlying causes. • Diffusion • Breed • Spread SLEUTH does not put constraints on growth, such as: • Population Growth Projections • Economic Growth Projections • Extrapolates from previous growth. Uses Self-Modification Rules ("Boom" and "Bust") to produce realistic S-shaped growth curve projections based on recent growth, but not constrained to match other models' projections. Slope Resistance Road Gravity 26
Limitations • Are SLEUTH's predictions of urban growth a satisfactory proxy for predictions of road network growth? • This study will provide an answer to that question • Compare actual 2006 road network growth using same goodness-of-fit metrics that SLEUTH uses for Validation. 27
Possibilities • Adapt model to constrain the outputs to match population or economic growth projections • Adapt the model to make use of demographic inputs • New NLCD data (2011) scheduled for release in December 2013 • Updated projections for the rest of this decade • Imagery for specific areas could be processed to create more frequent land cover datasets with which to update predictions. 28
Possibilities • Eventually it could be useful to model urban growth for the entire country. • SLEUTH's creator, Keith C. Clarke, has said that he would like to see the model used for the entire United States (Clarke, 2008 and 2011). • Jantz et al. 2009 study of the entire Chesapeake Bay watershed (208 counties) remains the largest application of SLEUTH to date that I found in the literature. • An eventual nation-wide simulation could provide estimates of completeness of coverage for TIGER that could support the Census Bureau's stated goals for targeted update operations. 29
Next Steps • Download and install Cygwin (Unix environment for Windows) • Read Cygwin documentation • Download and install SLEUTH software • Read Cygwin documentation • Download remaining TIGER datasets (Tract, All LInes) • Convert TIGER/Line files to shapefiles • Merge DEMs for test county • Run SLEUTH on test county, probably my hometown for familiarity: • Pima County, AZ (04019) • Estimate reasonable number of counties to process • Select counties for study • Streamline data download, setup, model run process • Download data for additional counties • Run SLEUTH model on counties • Validate output to 2006 land cover • Validate 2006 roads to 2006 land cover • Simulate TIGER update dates by Tract • Compare update dates to urban growth predictions by Tract • Create percent-likelihood-incomplete estimates by tract 30