Download
1 / 18
210 likes | 320 Views
ELECTRICAL ENERGY MONITORING. Symmetron Electronic Applications. Measure in order to be able to manage.

E N D
ELECTRICAL ENERGY MONITORING Symmetron Electronic Applications
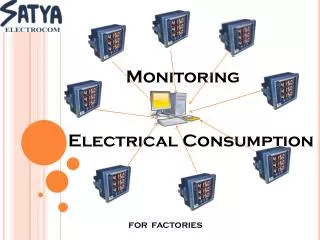
Measure in order to be able to manage. • By continuously monitoring the consumption of individual electrical loads (air conditioners, kitchen, elevators, etc) and the usage of hot water, you can extract useful conclusions and gain economic and other benefits (such as the 'green' label). • Obtain information, graphs and statistics that can not be extracted from the total electricity or oil bill and get the complete picture of the energy consumption of your business. • You can either buy the measuring equipment for permanent installation so that you manage your consumptions yourself, or you can receive the results of the data analysis by Symmetron, as a service, with weekly or monthly fee.
Benefits • Detect unexpected and unnecessary consumptions. • Avoid the expensive power peaks. • Control your automated functions. • Correct the power factor in the individual loads. • Detect yourenergy intensive processes and transfer them to reduced tariff hours. • Produce consumption statistics per hout, per day, per month or per year.
Statistics: Energy per day of the month, total and per line Besides the total energy per day of the month, the individual consumptions are also available. View which consumption is the most energy intensive or if a load consumes more than expected
Statistics: Energy per hour of the day, total and per line • Monitor the total and individual consumptions per hour of the day. Which hours do you consume more? ανά ώρα της ημέρας. Ποιες ώρες καταναλώνετε περισσότερο; Distribute your consumptions better
Statistics: Power factor per day of the month, total and per line • Correct the power factor of your problematic consumptions.
Excel: Data graph.Energy per day, total and per line View the total energy per day and per load. Here, the “remaining” consumptions are almost permanent and the most intensive average load . Which permanent consumptions of yours are not insignificant, as you expected?
Transients graph1. Total, 2. Elevators, 3. Air-conditioning Monitor the alteration of your consumptions’ power per second. For example, it is apparent that the air-conditioning units and the pumps are operating in large groups, according to the needs. Instead of them operating, e.g. in 2 groups of 3, (3 or 6 are operating), they could be added one by one and 1, 2, 3, 4 ,5 or 6 units can operate.
Transients graphAir-conditioning power, total and per phase Check the symmetry of a 3-phase load, such as the air-conditioning. As before, it is apparent that the air-conditioning units and the pumps are operating in large groups, according to the needs. Instead of them operating, e.g. in 2 groups of 3, (3 or 6 are operating), they could be added one by one and 1, 2, 3, 4 ,5 or 6 units can operate.
Air-conditioning transients graph 1. Power per phase, 2. Power factor per phase
Statistics: Average maximum power per hour of the day, total and of one individual load The maximum power charge is as follows: Each quarter, the maximum total power is measured and their average is calculated within the hour. This average maximum power is charged and has to be reduced. Detect which loads cause it the most
System Architecture • The basic system Symmetron offers includes a data logger with an optional telemetry module, multimeters, if they are required, and one current transformer per phase, all installed in a central electric panel of a professional building. The main power supply and the individual load lines will be monitored. • However, the system can be expanded and adjusted to your needs: • You may monitor multiple 3-phase and 1-phase loads. You may wish to monitor individually more 1-phase, “small” in theory, consumptions, such as lighting, which are not as small as you expected. • You may also monitor more individual loads, either as a further analysis of loads you are already monitoring (such as air-conditioning in: unit 1, unit 2, pumps, etc), or as smaller loads, such as lighting, pumps, etc. • Moreover, measure additional loads in multiple sub-panels, if they are, for example, in different floors. • You may also monitor various environmental parameters, such as external temperature, humidity or solar radiation, which may affect the consumption. For example, all 3 of these parameters can affect the performance and consumption of an air-conditioning unit. • The data logger records the measurements in its internal memory and in a removable2GB MicroSD memory card, with long-term data logging capacity. • The data retrieval directly from the data logger can be done as follows: • Locally, via a serial cable • Via LAN/ internet, via a built-in Ethernet module. • Via GSM/ GPRS, via a built-in modem.
About Symmetron Company Symmetron was founded in 1989 by experienced engineers and evolved as a manufacturer of dataloggers and supplier of measurement equipment. Symmetron is certified to the ISO9001 quality system.During the years, thousands of measurement systems were deployed worldwide by businesses, organizations and universities, in areas such as:- Analog and digital techniques.- Embedded design and programming.- Software development.- Sensor signal conditioning.- GSM, GPRS, Email, SMS and RF modem telemetry.- Safe Flash memory data storage techniques.- Non-stop operation in extreme environmental conditions.Symmetron products find applications in:- Wind energy assessment.- Solar energy measurements.- Water pipe management.- Electrical energy measurements.- General data acquisition and remote control.The company has also participated in several development programs with universities and other organizations. These range from a hybrid small grid simulator to fast photon pulsers for scientific experiments.
Most important clients Clients using our electric energy andhot water management systemsinclude: • Hotels in Greece: Civitel (Kifissia- Athens), Attik (Amaroussion- Athens), CretaBeach(Iraklion), Akali (Chania). • CRES (Κέντρο Ανανεώσιμων Πηγών Ενέργειας) εκτελεί συμβόλαια πιστοποίησης κτιρίων με εξοπλισμό μας. • The Malaysian εταιρία παροχής ηλεκτρικού ρεύματος (ΤΝΒ). • Various industriesinNorthern Greece, cooperating withSCIENTACT company. • Various Photovoltaic plants, moitored by companies, such asQPV, Build-IT, etc. More clients from the renewables measurement field are: • CRES • 2EN S.A. • ROKAS RENEWABLES SA • TERNA ENERGY SA • ELLAKTOR Group • WIND ENGINEERING • BARLOVENTO RECURSOS NATURALES • JEFFERSON LAB • EDF • GAMESA • FLUKE
Contact information Symmetron Electronic ApplicationsHadjidakis N. – Katsambakou T. CO.tel:+30-210-6034002fax: +30-210-6034003 email: info@symmetron.gr Address: 1, Antikythiron Str.153 44 Gerakas- Attiki Greece