Download
1 / 31
370 likes | 531 Views
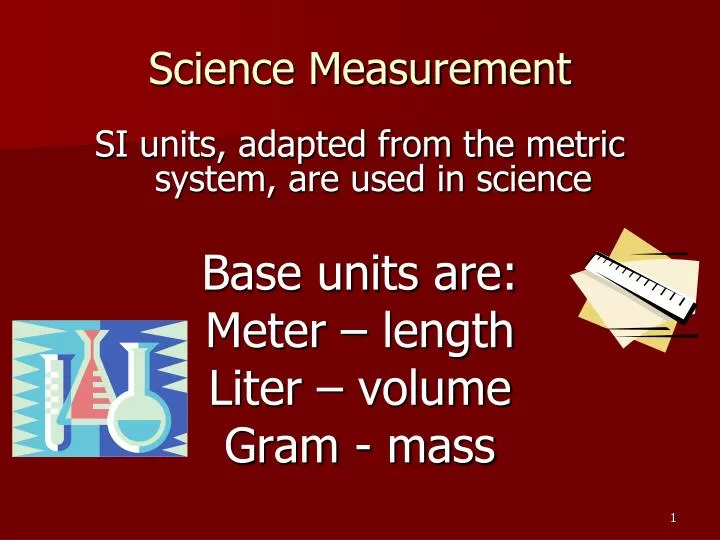
Science Measurement. SI units, adapted from the metric system, are used in science Base units are: Meter – length Liter – volume Gram - mass. Graphs. D ependent Variable R esponsive Variable Y - axis. Growth of plant. Type of Soil. M anipulated Variable I ndependent Variable X - axis.

E N D
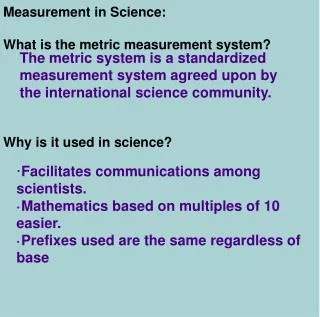
Science Measurement SI units, adapted from the metric system, are used in science Base units are: Meter – length Liter – volume Gram - mass
Graphs DependentVariable Responsive Variable Y- axis Growth of plant Type of Soil Manipulated Variable Independent Variable X- axis
Types of Graphs - LINE Different types of graphs are used to show different relationships between data Line graphs – show continuous change Quantitiy
Types of Graphs - BAR Different types of graphs are used to show different relationships between data Bar graphs – compare two measured variables (show differences)
Types of Graphs- PIE Different types of graphs are used to show different relationships between data Pie graphs – show percentages
Democritus named the atom • 2,500 years ago, the Greek philosopher Democritus, decided that matter was made up of tiny, indivisible units called “atoms”.
Graduated Cylinder and Beaker Both measure volume in mL, but the graduated cylinder is more precise.
Meniscus "A characteristic of liquids in glass containers is that they curve at the edges. This curvature is called the meniscus. You measure the level at the horizontal center or inside part of the meniscus. With water in glass, the meniscus will curve up at the edges and down in the center. Always read the bottom of the meniscus."
Science Measurement Volume for Irregular Objects Volume is measured using a graduated cylinder Irregular Objects: Rock Final Volume Marble - Initial Volume
Science Measurement Volume for Regular Objects Volume=Length x width X height Regular Objects: Square Rectangle
Spring Scale Measure WEIGHT in Newtons
Triple Beam Balance Measures MASS in GRAMS Always carry this with 2 hands!
Microscope • Calculate total magnification by multiplying the power of the eye lens X the power of the objective lens
Goggles • Protective plastic goggles are worn during experiments to keep your eyes safe.
Telescope Used to view far away objects, like stars and planets. Contains lenses or mirrors to magnify distant objects.
Test Tube A glass tube used to hold or heat substances. Never point the open end of a test tube at anyone!
Hot plate • An electrical plate used to heat substances in a lab investigation. Always protect yourself!
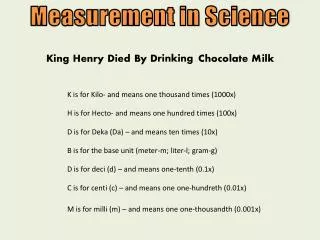
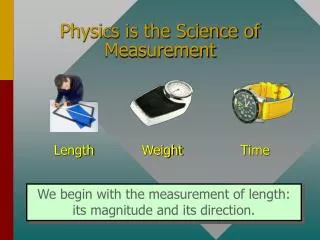
Meter Stick • A ruler marked in millimeters, centimeters & meters used to measure length.
Petri Dish A round, flat dish with a cover that is used to grow microorganisms in the lab.
Thermometer • Measures temperature in degrees Celsius (oC)
Anemometer • A weather instrument used to measure wind speed.
Barometer Weather instrument that measures atmospheric pressure. Changes in barometric pressure usually indicate a change in weather.
Dissecting Equipment • Equipment such as a scalpel, forceps & dissecting probe used to cut open and examine preserved specimens or to take apart a flower.
Independent Variable The MANIPULATED or CHANGED factor in an experiment. This is the variable controlled by the person doing the experiment. Ex: You may change the amount of water you give a plant or the amount of fertilizer applied to soil.
Dependent Variable The outcome or RESULT of manipulating or changing the independent variable. What happens to the dependent variable is the EFFECT of what the experimenter does to the independent variable
Inferences Conclusions that go beyond the facts
Promotional Claim A statement used to sell a product or service. Can sometimes be misleading, so you need to understand basic science facts to be able to evaluate how valid the information is.
Valid conclusion Valid results are those that are well-supported by evidence. When scientific findings are evaluated, a scientist looks for reliable and accuracy. Multiple trials, or sets of data, give us more reliable and valid information. VALID results are REPRODUCIBLE – they can be recreated by other scientists.
Topographic map (Contour map) Special kind of map that shows the height or elevation of land areas.
Contour lines Lines that represent equal elevation Contour intervals The space between the contour lines- The smaller the space (closer the lines) the steeper the slope. Contour lines & intervals
Models A diagram or an object that represents something else & demonstrates how it works. Models aren’t exactly the same as what they represent so they have limitations and can always be improved. Questions to ask about models- • How closely does it resemble what it represents? • What does the model show? • How might the model be improved?