GLOBAL INVESTING
270 likes | 382 Views
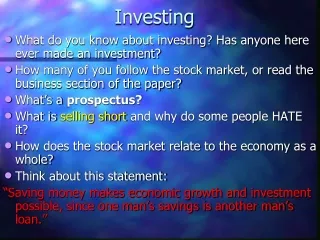
Understand the benefits of global investing, opportunities beyond your backyard bias, and why diversification across markets is crucial for long-term growth.

GLOBAL INVESTING
E N D
Presentation Transcript
GLOBAL INVESTING IS IT TIME TO RELOCATE SOME OF YOUR PORTFOLIO? Name TitleCompany DATE
2. 3. 1. AGENDA THE BACKYARD BIAS HAVING A GLOBAL PERSPECTIVE GLOBAL GROWTH OPPORTUNITIES
OutsideCanada38% Canada62% CANADIANS HAVE A BACKYARD BIAS CANADIANS HAVE THE MAJORITY OF THEIR ASSETS INVESTED IN CANADA Source: IFIC mutual fund assets, as of June 30, 2011. Includes Equity, Balanced and Fixed Income Mutual Fund Assets.
YOU CAN’T BLAME THEM CANADA HAS OUTPERFORMED THE WORLD MARKET OVER THE PAST 10 YEARS Canada World Source: Morningstar, Canada as represented by the S&P/TSX Total Return Index, World as represented by MSCI World Index in Canadian Dollars. January 3rd, 200 to December 1, 2011. The chart above is for illustrative purposes only.
3 SECTORS: • 78% of Canadian market CANADA’S STRONG PERFORMANCE CONCENTRATION IN 3 SECTORS HAS HELPED PERFORMANCE OVER THE PAST 10 YEARS Source: Morningstar, as of November 30th, 2011.
CANADA’S STRONG PERFORMANCE RISE IN DOLLAR HAS MIRRORED RISE IN MARKET Canadian Dollar S&P/TSX Source: Yahoo Finance. Bank of Canada December 31, 2001 to December 23, 2011
4 SECTORS: • 9% of Canadian market • 43% of U.S. market • Positive performance YTD • 3 SECTORS: • 78% of Canadian market • Negative performance YTD PEFORMANCE FACTORS CHANGE CANADIAN CONCENTRATION IN 3 SECTORS HAS HURT PERFORMANCE. YTD: +1% YTD: -6.9% Sector Weight Sector Performance Source: Morningstar, as of November 23rd, 2011.
PEFORMANCE FACTORS CHANGE CANADIAN DOLLAR HAS STABILIZED Source: Bank of Canada as of January 4th, 2010 to December 1st, 2011.
LONG TERM TREND HISTORICALLY CANADIAN OUTPEFORMANCE LED TO LONGER LARGER GLOBAL OUTPERFORMANCE CANADA OUTPERFORMS WORLD OUTPERFORMS Difference between S&P/TSX Total Return Index and MSCI World Index ($Cdn) rolling 5 year periods, as of November 30, 2011 Source: Morningstar, S&P/TSX Total Return Index and MSCI World Index ($Cdn). The S&P / TSX Total Return Index and MSCI World Index is unmanaged and unavailable for direct investment. Assumes reinvestment of capital gains and dividends and no taxes. Index past performance is not indicative of future results. For illustrative purposes only.
WORLD BASED ON ECONOMIC SIZE TALE OF TWO WORLDS WORLD BASED ON GEOGRAPHIC SIZE Source: As of 2008, CIA Factbook for GDP data. Economic size based on GDP Growth Rate. Natural Earth website for shapefiles of the world.
CANADA’S SMALL GLOBAL FOOTPRINT SMALL PERCENTAGE OF THE WORLDS LARGEST AND MOST RECOGNIZABLE COMPANIES BASED ON THE FORTUNE GLOBAL 500 LIST ARE IN CANADA CANADA 2% REST OF THE WORLD Source: Fortune Global 500, 2011.
$1,800,000 $1,600,000 $1,400,000 $1,200,000 $1,000,000 $800,000 $600,000 $400,000 $200,000 $0 6 Largest Companies Canada SMALL GLOBAL FOOTPRINT 6 LARGEST COMPANIES IN THE WORLD ARE LARGER THAN THE ENTIRE CANADIAN MARKET MARKET CAPITALIZATION IN 000’S Source: Morningstar, Financial Times Global 500. Canada’s market cap as of Nov 30, 2011. Companies market caps are as of Oct 31, 2011.
IMPORTANCE OF GLOBAL DIVERSIFICATION THE BEST PERFORMING COUNTRIES CHANGE FROM YEAR TO YEAR Source: Paltrack, Dynamic Funds. All Indices are represented in Canadian dollars Mexico – BMV IPC. U.S. – S&P 500 Total Return. England – FTSE 100 Total Return. Canada – S&P/TSX Total Return. Germany – FSE DAX Total Return. Brazil – BOVESPA. France - Euronext Paris CAC 40 PR. Japan – Nikkei 225 Average PR. Hong Kong – Hang Seng Hong Kong Composite.
Emerging Markets Canadian Equities Foreign Developed Markets CPP HAS GONE GLOBAL CANADIAN PENSION PLAN INVESTS THE MAJORITY OF THEIR EQUITY PORTFOLIO OUTSIDE OF CANADA Source: Canadian Pension Plan Annual Report, as of March 31, 2011.
OutsideU.S. In theU.S. U.S. CORPORATE REVENUE IS DIVERSIFIED U.S. COMPANIES EARN A SIGNIFICANT AMOUNT OF REVENUE OUTSIDE THE U.S. Source: RBC Economics, % of revenue of S&P 500 Companies.
AND GROWING U.S. CORPORATE PROFITS Source: U.S. Department of Commerce, Bureau of Economic Analysis.
HOWEVER U.S. STOCKS REMAIN CHEAP PRICE TO EARNINGS LEVELS OF THE S&P 500 Source: Morningstar, November 30th 1999 to October 31st 2011.
OPPORTUNITY IN EMERGING MARKETS THE RISE OF THE DOMESTIC CONSUMER NUMBER OF HOUSEHOLDS IN CHINA WITH DISPOSABLE INCOME ABOVE $10,000 U.S. MILLIONS Source: Euromonitor International “Top 10 largest economies in 2020” July 7, 2010
OPPORTUNITY IN EMERGING MARKETS INDIA AND CHINA PURCHASED 70% MORE PASSENGER VEHICLES THAN THE U.S. IN 2010 MILLIONS Source: Time Mag. “Your Next Job: Made in India or China” March 17, 2011
OPPORTUNITY IN EMERGING MARKETS CHINA WILL BUILD ENOUGH SKYSCRAPERS TO FILL 10 NEW YORK-SIZED CITIES BY 2025 Sources: McKinsey & Co. report "Preparing for China's urban billion" March 2009
EMERGING MARKETS SET TO DRIVE ECONOMIC GROWTH 2012 FORECASTED GDP GROWTH Source: Goldman Sachs Global ECS Research, Dec. 2010
Kitchen Computers Wireless Phone Automobile Entertainment Electrolux Lenovo Iphone GM Samsung Frigidaire HP Blackberry Chrysler Panasonic Whirlpool Apple Samsung Ford LG Maytag Dell Nokia BMW Sony Kitchenaid Acer HTC Mercedes Sharp Jenn-Air Gateway Motorola Nissan Bose Bosch Toyota eMachines Yamaha Siemens Honda Toshiba Miele Mazda Hyundai/Kia Volkswagen Mitsubishi Fiat Volvo YOU’RE ALREADY A GLOBAL INVESTOR
IMPORTANT INFORMATION Commissions, trailing commissions, management fees and expenses all may be associated with mutual fund investments. Please read the prospectus before investing. The indicated rates of return are the historical annual compounded total returns including changes in units value and reinvestment of all distributions and do not take into account sales, redemption, distribution or optional charges or income taxes payable by any securityholder that would have reduced returns. Mutual funds are not guaranteed, their values change frequently and past performance may not be repeated Views expressed regarding a particular company, security, industry or market sector should not be considered an indication of trading intent of any funds managed by Goodman & Company, Investment Counsel Ltd. These views are not to be considered as investment advice nor should they be considered a recommendation to buy or sell. This document is not to be distributed or reproduced without the consent of Goodman & Company, Investment Counsel. Dynamic Funds is a division of Goodman & Company, Investment Counsel Ltd.