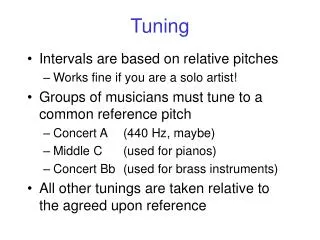
Tuning Your Application
Session 131. Tuning Your Application. Rob Marshall Principal Solutions Consultant, Progress Software. Agenda. Overview of a OERA application AppServer Code Testing Using the VSTs Using Profiler Interpreting the Results. Application Overview. Application Overview. The OERA Basics

Tuning Your Application
E N D
Presentation Transcript
Session 131 Tuning Your Application Rob Marshall Principal Solutions Consultant, Progress Software
Agenda • Overview of a OERA application • AppServer Code Testing • Using the VSTs • Using Profiler • Interpreting the Results
Application Overview The OERA Basics • Separate the UI from the Business Logic • Separate the Data Access from the Business Logic
Application Overview AppServer Data
AppServer Code Testing Why Test the code????
AppServer Code Testing • Verify it is as efficient as it can be • Run it locally to get profiler information • Capture VST information • Verify the output
AppServer Code Testing IF vAppServer THEN DO: /* Connect to AppServer */ CREATE SERVER hAppSrv. vRet = hAppSrv:CONNECT ("-sessionModel Session-free - AppService " + cASName + " -H " + cASIP + " -S 5162","adm-gym",""). /* If error, run the routine locally and inform the developer */ IF NOT vRet THEN DO: MESSAGE "Failed to Connect to AppServer - Running Locally“ VIEW-AS ALERT-BOX. RUN common/commonprocs.p PERSISTENT SET CommonProcs. SESSION:ADD-SUPER-PROCEDURE(hCommonProcs). END. END. ELSE
AppServer Code Testing IF vAppServer AND VALID-HANDLE(hAppSrv) THEN DO: /* We are running on the AppServer, and we are connected to it */ RUN "salesorder/SI/Get.p" ON SERVER hAppSrv (INPUT ?, /* Session ID */ INPUT ?, /* RowID */ INPUT 0, /* ProdID */ INPUT 0, /* Rev */ OUTPUT TABLE-HANDLE phttError, OUTPUT DATASET DSProposal). END. ELSE DO: /* We are running locally */
Using VSTs Ask not what you can do for your VSTs, but what your VSTs can do for you….. So What is a VST…..
Using VSTs Background Check • Index Range Size (-indexrangesize) • Table Range Size (-tablerangesize)
Using VSTs Major VST’s to review • IndexStat – Shows index usage, look for unused indexes or inefficient index usage in your tests • TableStat – Shows table usage, look for excessive reads or updates Gotcha’s…. • These VSTs are from the start of the DB server, not your specific session
Using VSTs Your VSTs: • _UserIndexStat – Shows index usage for this session • _UserTableStat – Shows table usage for this session • _UserIO – shows overall DB access for the session • _MyConnection – Is the current connection you are using
Tools VSTs are nice, BUT…….. What other tools are available?
Tools • The Profiler Utility • OpenEdge Management • Compile Listing • Compile XREF • Many third party tools (PEG, OEHive, PSDN, etc)
Using Profiler • Profiler is a tool, not a automatic fix utility • It can help identify areas of performance concern • Profiler is officially unsupported but many folks in the Global Progress community extend it and it is a very useful tool
Using Profiler • To get the best results, you need source code in your path • Profiler does not count time used to enter data, only execution time
Using Profiler Look for sections of code with • Long execution times • Many iterations • Called often
Using Profiler To Use In-Line Arguments to turn on Profiler: IF vProfiler THEN DO: /* * Start Profiler using in-line directives */ PROFILER:ENABLED = TRUE. PROFILER:LISTINGS = TRUE. PROFILER:COVERAGE = TRUE. PROFILER:DESCRIPTION = cProfDesc. PROFILER:FILE-NAME = cProfName. PROFILER:DIRECTORY = cProfDir. PROFILER:PROFILING = TRUE. END.
Using Profiler To Use In-Line Arguments to turn off Profiler: IF vProfiler THEN DO: /* * Turn off profiling using in-line directives */ PROFILER:PROFILING = FALSE. PROFILER:WRITE-DATA(). PROFILER:ENABLED = FALSE. END.
Using Profiler Profiler as a client start-up: In your normal client session startup add: -zprofile ProfileConfigFile The Profile Config File contains: -OUTFILE Filename -LISTINGS [Directory] -DESCRIBE Description
Interpreting the Results Now that we have captured some data, what next?
Interpreting the Results You may need to edit your .out file….. 6 "DaypartLookup vehicle/bevehicle.p" "" 0 2 "Vehicle/SI/VehicleLookup.p “/tmp/list/dbg_VehicleLookup_6ca05444" 34782 4 "ClearMessages common/commonprocs.p" "" 0 3 "ServiceAdapter common/commonprocs.p" "" 0 5 "vehicle/bevehicle.p" “/tmp/list/dbg_bevehicle_6da05444" 28781
In Summary You can use simple tools (including OpenEdge Management) The performance review process can be easily incorporated into any development process Ensuring performance during the development process saves effort later
Session 131 Tuning Your Application Rob Marshall Principal Solutions Consultant, Progress Software