Addressing Student Retention and Achievement Challenges in Diverse Populations
110 likes | 234 Views
Each year, many students, particularly freshmen and sophomores, struggle academically and face high retention rates. For instance, Hispanic students exhibit a retention rate 33-44% over the past five years, while Caucasian students show an 8.3-18.7% rate. Our surveys indicate that various stakeholders have identified concerns regarding educational strategies and cultural relevance. Despite improvements in scores for special populations, significant achievement gaps remain. Focused intervention on English Language Learners and Free/Reduced Lunch students is critical to reversing these trends.

Addressing Student Retention and Achievement Challenges in Diverse Populations
E N D
Presentation Transcript
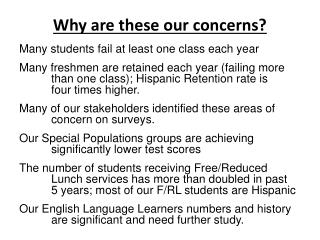
Why are these our concerns? Many students fail at least one class each year Many freshmen are retained each year (failing more than one class); Hispanic Retention rate is four times higher. Many of our stakeholders identified these areas of concern on surveys. Our Special Populations groups are achieving significantly lower test scores The number of students receiving Free/Reduced Lunch services has more than doubled in past 5 years; most of our F/RL students are Hispanic Our English Language Learners numbers and history are significant and need further study.
Class failure rates • Sophomores have the highest failure rates = 13.5% of sophomores failing one or more classes. • Freshman failure rate = 12.9% failed one or more classes. With Freshman Academy, we see those numbers dropping ______. • Juniors = 11.8% on average fail one or more classes • Seniors = 3.3% average fail one or more classes
Retention Rates Freshmen failing more than one class: • CAUCASIAN retention rate is 8.3 – 18.7% ** it was down to 10.5% last year. • HISPANIC freshman retention rate is 33-44% average in the past five years. (What is our sophomore retention rate?)
Survey Results NAAS Staff Survey: (Remember 48 questions on blue paper?) The majority of staff marked “Substantially Met” on 32 of the questions. On the other 16 questions, the majority of the staff marked “Partially Met” or “Not Met.” Most of these questions asked about “Instructional Strategies.” There were survey questions where stakeholders disagreedmost with: “Students have good study skills.” “Students find the relevance between what they are studying and their futures.” “Galena effectively addresses cultural diversity, respect, and tolerance.” “Galena encourages students to be advocates for their own education.” “Galena’s Special Populations are academically successful.”
Special Populations Groups Achievement Gap
Hispanics: • HSPE Math – Below benchmark by 4% and 35% lower pass rate than Caucasians • HSPE Reading – Improving but 10% lower pass rate than Caucasian group • HSPE Writing – Improving; 9% lower pass rate than Caucasian group • On ITED Math - scoring at least 36 percentile lower than Caucasian group • On ITED Reading - scoring 40-50 percentile points lower than Caucasian group • On ITED Writing – scoring about 50 percentile points lower than Caucasian group
English Language Learners • HSPE Math – Improving but ELL pass rate is 34% lower than school pass rate • HSPE Reading – Improving but 14% lower than school pass rate. • HSPE Writing – no data • ITED Math – ELL scoring over 46 percentile lower than school average • ITED Reading - scoring at least 36 percentile points lower than school • ITED Writing – scoring at least 35 percentile points lower than school average
SPECIAL EDUCATION students: • HSPE Math – Improving but 22% lower pass rate than school average • HSPE Reading – Improving but 15 % lower pass rate than school average • HSPE Writing – Struggling with at least 33% lower pass rate than school average • ITED Math – Struggling; scoring 40-50 percentile lower than school average • ITED Reading – Inconsistent; scoring 40-50 percentile lower than school average • ITED Writing – Struggling; scoring over 50 percentile lower than school average
FREE / REDUCED LUNCH STUDENTS • HSPE Math – Improving but 24% lower pass rate than school average • HSPE Reading – Improving but 10 % lower pass rate than school average • HSPE Writing – Improving but 9 % lower pass rate than school • ITED Math – Some improvement but 34 percentile lower than school average • ITED Reading – Improving but scoring about 40 percentile lower than school average • ITED Writing – Improving but scoring 35 percentile lower than school average
FREE / REDUCED LUNCH Enrollment Changes • The number of students receiving Free/Reduced Lunch services has increased from 8.9% of our student population five years ago to 21.6% last year. • Hispanics make up 22.3% of our total student population, yet they now receive 77.5% of our F/R L services.
English Language Learners Enrollment We have 205 “current and former” ELL students 147 ELL students have “exited” 71 of them “exited” over six years ago 25 of them “exited” five years ago 13 exited 4 years ago 17 exited 3 years ago 8 exited 2 years ago 7 exited 1 year ago How long does Language Acquisition take? *Dependent on age, education, how much new language spoken at home, etc. = 2-5 years minimum How long does it take to learn ACADEMIC language? Same variables – years longer