Download
1 / 1
10 likes | 142 Views
1979-2005. 1980-1989. 1990-1999. 2000-2005. 1979-2005. 1980-1989. 1990-1999. 2000-2005. Changes in the Melt Season and the Declining Arctic Sea Ice. J.C. Stroeve, W. Meier, T. Markus, J. Miller. http://nsidc.org. Background. Changes in Melt Season from Satellite Passive Microwave Data.

E N D
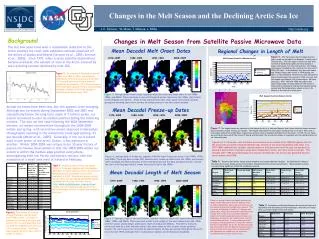
1979-2005 1980-1989 1990-1999 2000-2005 1979-2005 1980-1989 1990-1999 2000-2005 Changes in the Melt Season and the Declining Arctic Sea Ice J.C. Stroeve, W. Meier, T. Markus, J. Miller http://nsidc.org Background Changes in Melt Season from Satellite Passive Microwave Data The last few years have seen a remarkable reduction in the Arctic summer ice cover with extensive retreats observed off the shores of Alaska and Siberia [Stroeve et al., 2005; Serreze et al., 2003]. Since 1979, when routine satellite observations became available, the amount of area in the Arctic covered by sea ice during summer declined by over 20%. Mean Decadal Melt Onset Dates Regional Changes in Length of Melt Season Figure 6.The melt season has increased by more than a week per decade in the Beaufort, Chukchi and E. Siberian Seas. The only region in the Arctic that does not show a statistically significant trend towards a longer melt season is in the central Arctic. The longest melt season recorded for the central Arctic occurred in 1995 (122 days). In the Beaufort Sea, the melt season was 34 days longer than normal in 1998 (lasting 166 days). In the Chukchi/E. Siberian Sea, melt lasted more than a month longer than normal in 1990, the year with the longest melt season (162) in that region. All these years (e.g. 1990, 1995 and 1998) were years that experienced large ice losses either off the shores of Siberia and/or Alaska and indicate that warmer spring, summer and fall temperatures played a role in the decline of the sea ice in those years. Figure 1.Time-series of September sea ice extent from 1979 to 2005. Ice extent is obtained by summing all pixels with at least 15% ice and assuming that the area not imaged by the sensor is 100% snow covered. The linear least squares trend is also included showing a decline of 8.5% per decade in September ice cover since 1979. Figure 3.Average date of melt onset, together with the mean melt onset dates in the 1980s, 1990s, and 2000s. There has been a clear shift towards earlier melt since the 1980s, particularly north of Alaska and Siberia. These trends towards elier melt onset agree with trends towards springtime warming observed in surface air temperatures in the last couple decades. Chukchi E. Siberian Annual ice losses have been less, but this appears to be changing. Although sea ice extent during September 2002 and 2003 was substantially below the long-term mean of 7 million sq-km, ice extent recovered to near its median position during the following winters. This was not the case following the 2004 September minima: ice extent remained low throughout the 2004/2005 winter and spring, with record low extent observed in December through April resulting in the wintertime trend approaching -3% per decade [Meier et al., 2005]. Generally, if the ice is pulled back in one sector of the Arctic Ocean, it has advanced in another. Winter 2004/2005 was unique in our 30-year history of passive microwave observations in that the 2004/2005 winter ice extent is within the median edge position everywhere, encompassing both the Pacific and Atlantic sectors, with the exception of a small area west of Iceland in February. Laptev Kara Mean Decadal Freeze-up Dates Beaufort Central Arctic Barents 1979-2005 1980-1989 1990-1999 2000-2005 Figure 7.The largest trends are observed in the eastern Arctic (e.g. Kara and Barents Seas) where the melt season duration has increased by nearly 2 weeks per decade. The longest melt season for the Laptev and Kara Seas occurred in 1995, with a melt season lasting 167 and187 days, respectively and more than 2 standard deviations from the mean. In 1995, the ice losses were primarily observed off the shores of Siberia and therefore, the record melt season is consistent with the spatial pattern of ice losses that year. Figures 6 & 7 4 illustrate melt durations have become more variable since 1988 throughout most of the Arctic (the exception being the Barents Sea). Periods of low Arctic Oscillation (AO) index (e.g. 1979-1988) exhibited less variable melt durations in both perennial and first year ice because the dominant anticyclonic conditions would have maintained a cooler and more uniform climate. This changed after 1989 and interestingly, the amount of September sea ice has also generally become more variable after1988. Figure 4.Average date of freeze-up, together with the mean freeze-up dates in the 1980s, 1990s, and 2000s. There has been a clear shift towards later freeze-up dates since the 1980s, particularly north of Alaska and Siberia but also in the Greenland Sea and the Kara and Barents Seas. Overall, the ice is now freezing nearly 2 weeks later than it did in the 1980s. Table 2.Trends in melt onset, freeze-up and length of melt season (days per decade). Included are the values of the mean melt onset, freeze-up and melt duration (standard deviation given in parenthesis). Values shaded in yellow are statistically significant at the 95% confidence interval. Table 1. Monthly trends in Arctic ice extent (given in %/decade together with the standard deviation) for each calendar month derived from satellite passive microwave observations beginning in 1979. Extents are given in million sq-km. Plots can be viewed and extent figures obtained from the Sea Ice Index archive (http://nsidc.org/data/seaice_index/archives/). Trends that are statistically significant at the 95% confidence interval or higher are shaded in light gray. Mean Decadal Length of Melt Season There is a strong inverse correlation between the length of the melt season and the amount of sea ice left in September, where years with low sea ice correspond to years with longer melt seasons. This is true for the Beaufort, Chukchi, E. Siberian and Laptev Seas, where the correlation coefficients are around -0.8. Little or no correlation between length of the melt season and amount of sea ice in September is found for the central Arctic, and the Kara and Barents Seas. Freeze-up dates are also strongly correlated (between 0.7 and 0.8) with the amount of September sea ice for all regions except the central Arctic and the Barents Sea whereas the timing of melt onset shows less correlation with the September ice conditions, yet a positive correlation exists in the western Arctic. Table 3.Correlation coefficients between the amount of sea ice in September with the timing of when melt begin, when the ice freezes back up and the length of the melt season. Figure 2.Time-series of October through February sea ice extent from 1979 to 2005. Ice extent is obtained by summing all pixels with at least 15% ice and assuming that the area not imaged by the sensor is 100% snow covered. The linear least squares trend for each moth is shown in Table 1. Figure 5.Average length of the melt season, together with the mean melt season duration in the 1980s, 1990s, and 2000s. There has been a shift in the length of the melt season since the 1980s, with the season lasting longer particularly north of Alaska and Siberia. This shift is primarily influenced both by a shift towards earlier melt onset dates as well as later freeze-up dates. Overall, the melt season has increased by approximately 10 days per decade throughout the Arctic since the late 1970s although there is substantial regional and interannual variability.