Download

1 / 14
170 likes | 946 Views
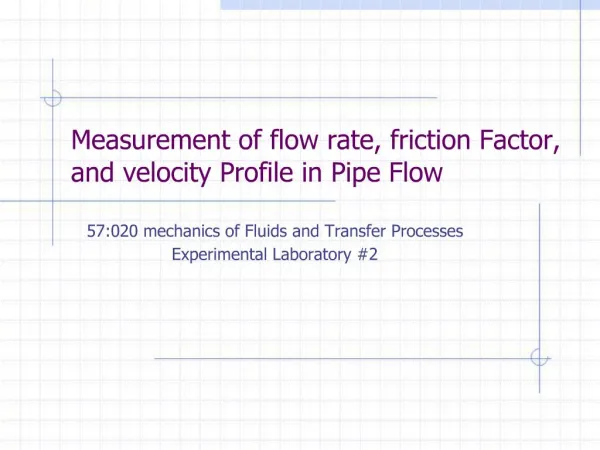
Measurement of flow rate, friction Factor, and velocity Profile in Pipe Flow. 57:020 mechanics of Fluids and Transfer Processes Experimental Laboratory #2. Purpose. Measure Flow rate in a pipe (smooth) Friction factor Velocity profile Specify the turbulent-flow Reynolds Number

E N D
Measurement of flow rate, friction Factor, and velocity Profile in Pipe Flow 57:020 mechanics of Fluids and Transfer Processes Experimental Laboratory #2
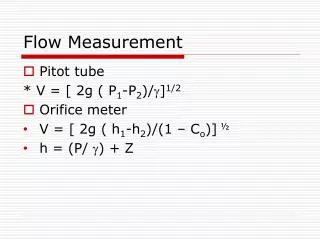
Purpose Measure • Flow rate in a pipe (smooth) • Friction factor • Velocity profile • Specify the turbulent-flow Reynolds Number • Compare the results with benchmark data • Uncertainty analysis for: • Friction factor • Velocity profile
Test Design The facility consists of: • Closed pipe network • Fan • Reservoir Instruments used: • 3 Venturi meters • Simple water Manometer • Differential Water manometer • Pitot Probe • Digital Micrometer (Accurate radial positioning)
Pressure tap manifold Pitot-tube housing Pressure tap manifold and Pitot-tube housing
Measurement Systems: The equipment used in the experiment includes: • Digital thermometer with a range of – 40 to 450 F and a smallest reading of 0.1 F for measurement of the environment temperature. • Digital micrometer with least significant digit 0.01 mm for positioning the Pitot-tube inside the pipe. • Simple water manometer with a range of 2.5 ft and a least scale division of 0.001 ft for measurement of the head at each pressure tap along the pipes and for measurement of velocities using the Pitot-tube arrangement . • Differential water manometer with a range 3 ft and a least scale division of 0.001ft for measurement of the head drop across the Venturi meters.
For the flow rate and friction factor, the individual measurement are performed for: Ambient air temperature (A.3) Pipe air temperature (A.5) Pipe pressure head Venturi meter pressure head drop The experimental Results are: Manometer water density Air density Kinematic viscosity Flow rate Reynolds number Friction factor Data reduction equations are: Measurement Systems (continue)
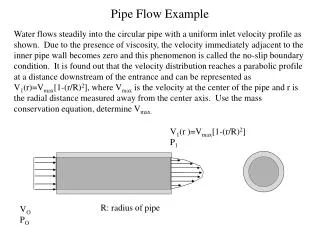
Measurement Systems (continue) • For the velocity profile, the individual measurement systems are for: • the ambient temperature • pipe air temperature • pitot stagnation and static pressure heads. • The experimental results are for: • manometer water density (A.3) • Air density (A.5) • Velocity profile (below) • Data reduction equation: (using the Bernoulli equation along the manometer equation)
Block diagram of the experimental determination of the Friction Block diagram of the Velocity measurement Flow rate, Friction factor and velocity profile measurement systems
Data Acquisition and reduction • The procedures for data acquisition and reduction are described as follow: • Use the appropriate Venturi meter, (2” smooth pipe) measure the head drop • Take reading for ambient air (manometer water) and pipe air temperatures. • To obtain velocity data, measure in the appropriate Pitot-tube box, the ambient head and stagnation heads across the full diameter. Measure the stagnation heads at radial intervals. The recommended radial spacing for one half of the diameter is 0, 5, 10, 15, 20, 23, and 24 mm. • Maintaining the discharge, measure the head along the pipe by means of the simple water manometer connected to the pressure taps located along the pipe being studied (10 times for uncertainty analysis) • Repeat step 2 • Execute data reduction for data analysis and uncertainty analysis using equation above
Uncertainty Analysis • The data reduction equation for the friction factor is: However here we will only consider bias limits for ZSM i and ZSM j . The total uncertainty for the friction is: The Bias Limit, Bf and the precision limit, Pf, for the result are given by:
Uncertainty Analysis (continue) • Data Reduction equation for the velocity profile is as follow: