Download
1 / 9
90 likes | 253 Views
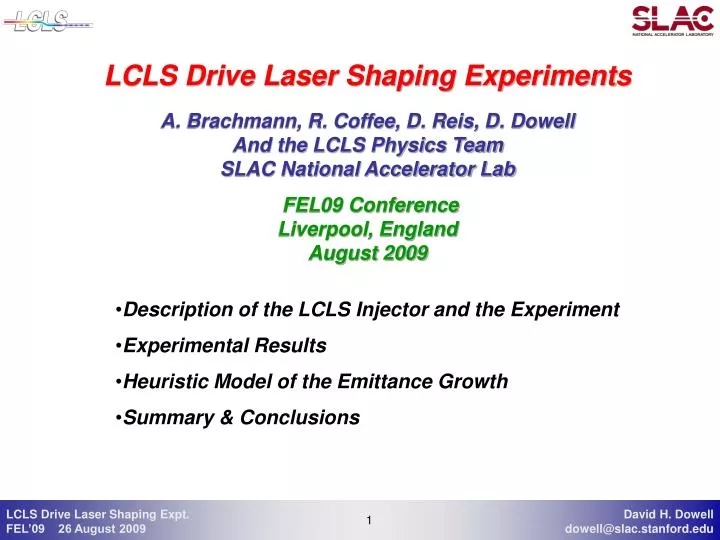
LCLS Drive Laser Shaping Experiments A. Brachmann, R. Coffee, D. Reis, D. Dowell And the LCLS Physics Team SLAC National Accelerator Lab FEL09 Conference Liverpool, England August 2009. Description of the LCLS Injector and the Experiment Experimental Results

E N D
LCLS Drive Laser Shaping ExperimentsA. Brachmann, R. Coffee, D. Reis, D. Dowell And the LCLS Physics TeamSLAC National Accelerator LabFEL09 Conference Liverpool, EnglandAugust 2009 • Description of the LCLS Injector and the Experiment • Experimental Results • Heuristic Model of the Emittance Growth • Summary & Conclusions
Emittance Measurements The LCLS Injector with Diagnostics Location of Injector Diagnostics Gain Length & Extraction Measurements ~1.5 km Projected emittance at 1 nC Nominal Operating Parameters
The Seven Laser Shapes 180 mesh 32 cycles per 1.2 mm 38 micron line spacing 50 mesh 9 cycles per 1.2 mm dia. 133 micron line spacing Nominal 1.2 mm dia. Bagel Gaussian Airy Diffraction Donut Measure for Each Shape: Projected & Slice Emittance Gain Length FEL Extraction
Summary of Experimental Results Projected Emittance at 135 MeV Gain Length (m) at FEL wavelength 1.5 A Energy Loss (MeV) of e-Beam After Lasing Red lines indicate the nominal values
The Gain Length vs. Emittance The emittances were measured at 250 pC and 135 MeV. The FEL gain lengths are for lasing at 1.5 Angstroms with an electron beam energy of 13.63 GeV. Gain Length vs. Emittance 2.4 meters/micron Slice vs. Projected: Offset = 0.13 microns Slope = 0.995
A Simple Model for the Emittance Growth • Basic Assumptions of Model • Charge is distributed in a regular array of tubes, beamlets. • Beamlets see radial space charge force until they overlap. • After overlapping the sc-force becomes small, the electrons are left with radial velocity which becomes emittance. Beam consists of a rectangular array of beamlets, each driven outward by their radial space charge force ~4 r0 r0 Area (cell) occupied by each beamlet is: (4r0)2 Radial electric field outside the tube/beamlet of charge: Number of beamlets is: Integrate to get energy gain of electron at radial edge of beamlet: Leap of faith: Assume Then the emittance definition: Gives the emittance due to the rectangular array of beamlets:
Simple Model Compared to the Expt. General parameters: For 50 mesh pattern: 1.8 Projected Emittance (microns) For 180 mesh, the emittance will be 180/50= 3.6 times smaller: Nominal Emittance
GPT Simulation Shows Beamlet Expansion in Early Life of the Beam 50 Mesh Laser Shape Bagel Laser Shape GPT: General Particle Tracer, Pulsar Physics, www.pulsar.nl
Summary and Conclusions • Measured Emittance and FEL Performance at 1.5 A for rectangular grid and radial symmetric laser transverse shapes. • Found most uniform shape gives the lowest emittance and shortest gain length. • Derived model for emittance growth based on radial expansion of beamlets driven by space charge force. • Using this model, derived relation for emittance due to regular rectangular pattern. Reasonable agreement with measurements. • Model can be extended to other radial shapes. • Comparison with GPT simulation indicates most growth occurs during expansion during ~10s of ps. • Particle tracking simulations using GPT are in progress.