Download
1 / 22
250 likes | 654 Views
Nuclear Magnetic Resonance Spectroscopy. The Use of NMR Spectroscopy. Used to map carbon-hydrogen framework of molecules Most helpful spectroscopic technique in organic chemistry Depends on very strong magnetic fields. Nuclear Magnetic Resonance Spectroscopy.

E N D
The Use of NMR Spectroscopy • Used to map carbon-hydrogen framework of molecules • Most helpful spectroscopic technique in organic chemistry • Depends on very strong magnetic fields
Nuclear Magnetic Resonance Spectroscopy • 1H or 13C nucleus spins and the internal magnetic field aligns parallel to or against an aligned external magnetic field. • Parallel orientation is lower in energy making this spin state more populated • Radio energy of exactly correct frequency (resonance) causes nuclei to flip into anti-parallel state • Energy needed is related to molecular environment
The Nature of NMR Absorptions • Electrons in bonds shield nuclei from magnetic field • Different signals appear for nuclei in different environments
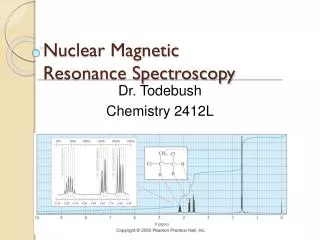
Chemical Shifts • The relative energy of resonance of a particular nucleus resulting from its local environment is called chemical shift • NMR spectra show applied field strength increasing from left to right • Left part is downfield is upfield • Nuclei that absorb on upfield side are strongly shielded. • Chart calibrated versus a reference point, set as 0, tetramethylsilane [TMS]
13C NMR Spectroscopy: Signal Averaging and FT-NMR • Carbon-13: only carbon isotope with a nuclear spin • Natural abundance 1.1% of C’s in molecules • Sample is thus very dilute in this isotope • Sample is measured using repeated accumulation of data and averaging of signals, incorporating pulse and the operation of Fourier transform (FT NMR) • All signals are obtained simultaneously using a broad pulse of energy and resonance recorded • Frequent repeated pulses give many sets of data that are averaged to eliminate noise • Fourier-transform of averaged pulsed data gives spectrum
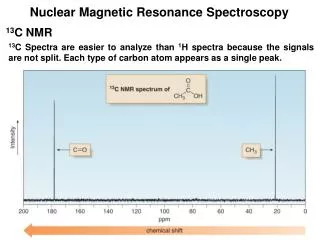
Characteristics of 13C NMR Spectroscopy • Provides a count of the different types of environments of carbon atoms in a molecule • 13C resonances are 0 to 220 ppm downfield from TMS • Chemical shift affected by electronegativity of nearby atoms • O, N, halogen decrease electron density and shielding (“deshield”), moving signal downfield. • sp3 C signal is at 0 to 9; sp2 C: 110 to 220 • C(=O) at low field, 160 to 220
Characteristics of 13C NMR Spectroscopy (Continued) • Spectrum of 2-butanone is illustrative- signal for C=O carbons on left edge
DEPT 13C NMR Spectroscopy • Improved pulsing and computational methods give additional information • DEPT-NMR (distortionless enhancement by polarization transfer) • Normal spectrum shows all C’s then: • Obtain spectrum of all C’s except quaternary (broad band decoupled) • Change pulses to obtain separate information for CH2, CH • Subtraction reveals each type (See Figure 13-10)
Uses of 13C NMR Spectroscopy • Provides details of structure • Example: product orientation in elimination from 1-chloro-methyl cyclohexane • Difference in symmetry of products is directly observed in the spectrum • 1-chloro-methylcyclohexane has five sp3 resonances ( 20-50) and two sp2resonances 100-150
1H NMR Spectroscopy and Proton Equivalence • Proton NMR is much more sensitive than 13C and the active nucleus (1H) is nearly 100 % of the natural abundance • Shows how many kinds of nonequivalent hydrogens are in a compound • Theoretical equivalence can be predicted by seeing if replacing each H with “X” gives the same or different outcome • Equivalent H’s have the same signal while nonequivalent are different • There are degrees of nonequivalence
Nonequivalent H’s • Replacement of each H with “X” gives a different constitutional isomer • Then the H’s are in constitutionally heterotopic environments and will have different chemical shifts – they are nonequivalent under all circumstances
Equivalent H’s • Two H’s that are in identical environments (homotopic) have the same NMR signal • Test by replacing each with X • if they give the identical result, they are equivalent • Protons are considered homotopic
Enantiotopic Distinctions • If H’s are in environments that are mirror images of each other, they are enantiotopic • Replacement of each H with X produces a set of enantiomers • The H’s have the same NMR signal (in the absence of chiral materials)
Diastereotopic Distinctions • In a chiral molecule, paired hydrogens can have different environments and different shifts • Replacement of a pro-R hydrogen with X gives a different diastereomer than replacement of the pro-S hydrogen • Diastereotopic hydrogens are distinct chemically and spectroscopically
Chemical Shifts in 1H NMR Spectroscopy • Proton signals range from 0 to 10 • Lower field signals are H’s attached to sp2C • Higher field signals are H’s attached to sp3C • Electronegative atoms attached to adjacent C cause downfield shift
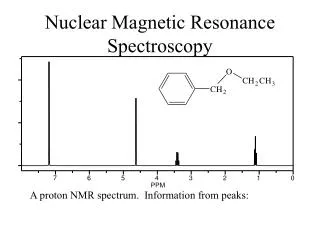
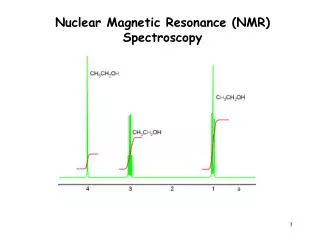
Integration of 1H NMR Absorptions: Proton Counting • The relative intensity of a signal (integrated area) is proportional to the number of protons causing the signal • This information is used to deduce the structure • For example in ethanol (CH3CH2OH), the signals have the integrated ratio 3:2:1 • For narrow peaks, the heights are the same as the areas and can be measured with a ruler
Spin-Spin Splitting in 1H NMR Spectra • Peaks are often split into multiple peaks due to interactions between nonequivalent protons on adjacent carbons, called spin-spin splitting • The splitting is into one more peak than the number of H’s on the adjacent carbon (“n+1 rule”) • The relative intensities are in proportion to a binomial distribution and are due to interactions between nuclear spins that can have two possible alignments with respect to the magnetic field • The set of peaks is a multiplet (2 = doublet, 3 = triplet, 4 = quartet)
Simple Spin-Spin Splitting • An adjacent CH3 group can have four different spin alignments as 1:3:3:1 • This gives peaks in ratio of the adjacent H signal • An adjacent CH2 gives a ratio of 1:2:1 • The separation of peaks in a multiplet is measured and is a constant, in Hz • J (coupling constant)
Rules for Spin-Spin Splitting • Equivalent protons do not split each other • The signal of a proton with n equivalent neighboring H’s is split into n + 1 peaks • Protons that are farther than two carbon atoms apart do not split each other
More Complex Spin-Spin Splitting Patterns • Spectra can be more complex due to overlapping signals, multiple nonequivalence • Example: trans-cinnamaldehyde
Uses of 1H NMR Spectroscopy • The technique is used to identify likely products in the laboratory quickly and easily • Example: regiochemistry of hydroboration/oxidation of methylenecyclohexane • Only that for cyclohexylmethanol is observed