Download

1 / 16
220 likes | 1.28k Views
Stress Concentration in Snap Ring Grooves. Jon Shelley Doug Hogge. Description of Project. Description of Project. Create a Model to Determine Stress in a Snap Ring Groove Calculate Stress Concentration Factor Create Graph Showing Stress Concentration

E N D
Stress Concentration in Snap Ring Grooves Jon Shelley Doug Hogge
Description of Project • Create a Model to Determine Stress in a Snap Ring Groove • Calculate Stress Concentration Factor • Create Graph Showing Stress Concentration • Compare Results to Actual Snap Ring Groove Dimensions
Results File Macro File Method Used to Accomplish Project
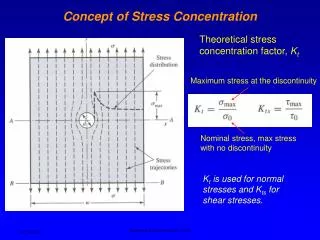
Model – Macro File !IMPORT PARAMETERS PARRES, CHANGE,ring,exp, !Keypoints k,1,0,0 k,2,0,l k,3,OD/2,l k,4,OD/2,t/2+r !Material Properties MP, EX, 1, 30.00000E+06 MP, NUXY, 1,0.27 !Mesh Constraints LESIZE,8, , ,12,0, , , ,1 ames,2 !Boundary Conditions and Loads SFL,8,PRES,-FYload, • !Solve Model • /SOLU • SOLVE • !Retrieve Output • nsort,s,y • *get,syMax,sort,0,max • !Save Output to a File • /output,ring,post,, • !Exit Macro File • /EXIT,NOSAVE,,,
Model-Geometry • Radius (0.005” – 0.015”) • Gap (0.1”) • OD (1”- 4”) • Ratio (1.02 – 1.1) • Height (2”)
Model-Mesh • Refined • Elements (1,649-10,132) • Nodes (5,140 – 31,005) • Mapped and Free Mesh • Original • Elements (53-400) • Nodes (200-1,517)
Model-Boundary Conditions • Surface Load • Axisymmetric Element • Symmetry about X-Axis
Model Verification • Original – (1 hr) • Refined – (7 hrs) • Two Models – (0.5% - 1%) • Original vs. Refined – (2% - 11%)
DOE • Outside Diameter • 13 Values (1” – 4”) • Radius • 4 Values (0.005” 0.007” 0.01” 0.015”) • Ratio of Outside to Inside Diameter • 9 Values (1.02 – 1.1) • Total of 468 Runs
DOE Results • Stress Increase as • Radius Decreases • Ratio Increase • OD Increases
Comparison to Actual Values • Error Between Actual and Calculated Values (0.05% - 4.09%)
Conclusion • Refined model produced less variation but increased processor time • Ansys can be used as a powerful tool for design studies • Model should be compared with actual data • From our results equations could be found to calculate stress concentration in snap ring grooves