Principle Component Analysis
Principle Component Analysis. Dr Poonam Goyal CS & IS BITS, Pilani. Introduction. how do we get from this data set to a simple equation of x ?. Introduction. How can we identify the most meaningful basis to re-express a data set

Principle Component Analysis
E N D
Presentation Transcript
Principle Component Analysis Dr PoonamGoyal CS & IS BITS, Pilani
Introduction how do we get from this data set to a simple equation of x ?
Introduction • How can we identify the most meaningful basis to re-express a data set • We hope that it will filter out the noise and reveal hidden structure • In the previous example, the goal is to determine the dynamics along the x-axis • Or to determine that x^ the unit basis vector along the x-axis is important
Introduction • D is a mxn matrix where m is the number of measurements and n is the number of observations • Each is m-dimensional vector spanned by some orthogonal basis • What is this orthogonal basis?
Preliminaries • Mean • Standard Deviation
Preliminaries • Variance • Covariance • Symmetric • -ve or +ve or zero • Covariance in three dimensions • Covariance matrix S
Preliminaries • Eigen Vectors • Eigen Values
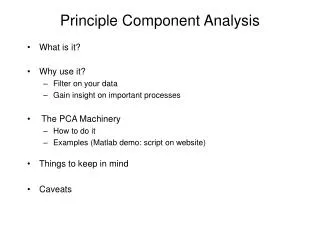
Principle Component Analysis • Characteristics • Tends to identify the strongest pattern in the dataset • Can be used as pattern finding technique • Retains most of the information which is present in the dataset • Most of the variability of the data can be captured by a small fraction of the total set of dimensions • Results in relatively low dimensional data • Techniques can be applied which don’t work well with high dimensional data • Can eliminate much of the noise • If noise in the data is weaker than the pattern (hopefully)
Geometric picture PCs • The 1st PC Z1 is a minimum distance fit to a line in X space • The 2nd PC Z2 is a minimum distance fit to a line in the plane perpendicular to the 1st PC • PCs are a series of linear least squares fits to a sample, each orthogonal to all the previous.
Principle Component Analysis • Goal is to find a transformation of the data which satisfies the following • Each pair of new attributes has covariance =0 • Attributes are ordered with respect to how much of the variance of the data each attribute captures • The first attribute captures as much of the variation of the data as possible • Subject to the orthogonality requirement , each successive attribute captures as much of as the remaining variance as possible
PCA • Covariance Matrix • For the adjusted matrix Cov=DTD
PCA • Choosing Components and forming a feature vector • Choose both the eigen vectors • Leave out the smaller and • have only single column • Called feature vector • Feature vector=(ev1,ev2,…., evp)
PCA • Driving the new dataset D’ • D’= Feature VectorT x DataAdjust
PCA • Getting the original data set back • Data AdjustT = (Feature VectorT)-1 x D’ • Original DataT = ((Feature VectorT)-1 x D’) + Original mean
PCA Fraction of variance accounted for by each principle component 0.9 0.1 3 1 2
Feature reduction • Transforming original data onto lower dimensional space • All original features are used • The transformed features are linear combinations of the original features • Most machine learning and data mining techniques may not be effective for high-dimensional data • The intrinsic dimension may be small
Feature Reduction Algorithms • Unsupervised • Singular Value Decomposition (SVD) • Independent Component Analysis (ICA) • Principle Component Analysis (PCA) • Correlation Analysis (CA) • Supervised • Linear Discreminant Analysis (LDA) All are linear algorithms
Singular Value Decomposition (SVD) • We know (DTD)evi=ievi • i s are positive real and termed as singular values and equal to i
Singular Value Decomposition (SVD) It is always possible to decompose matrix Dmxn into D = U L VT where UTU = I; V TV = I; the columns of U are orthonormal eigenvectors of DDT , and the columns of V are orthonormal eigenvectors of DTD L is a diagonal matrix containing singular values from U or V which are positive and sorted in decreasing order U is mxr matrix, L is rxr matrix and V is nxr matrix
Gram Schmidt Orthonormalization process • a1 is the first column eigen vector of A • normalize it to get the first orthonormal vector v1 • kth orthogonal vector is • Normalize it to get orthonormal vector vk • In our case A is the matrix of eigen vectors of the square matrix DDT or DTD
Example • Problem: • #1: Find concepts in text • #2: Reduce dimensionality
Singular Value Decomposition (SVD) For general rectangular matrix D D[m x n] = U[m x r]L [ r x r] (V[n x r])T • D: m x n matrix (e.g., m documents, n terms) • U: m x r matrix (m documents, r concepts) • L: r x r diagonal matrix (strength of each ‘concept’) (r: rank of the matrix) • V: n x r matrix (n terms, r concepts)
Singular Value Decomposition (SVD) D = ULVT Decomposition of a matrix D s1 x x = u1 u2 s2 v1 v2
SVD - Interpretation ‘documents’, ‘terms’ and ‘concepts’: • U: document-to-concept similarity matrix • V: term-to-concept similarity matrix • L: its diagonal elements: ‘strength’ of each concept Projection: • best axis to project on: (‘best’ = min sum of squares of projection errors)
SVD - Example • A = ULVT - example: retrieval inf. lung brain data CS x x = MD
SVD - Example • A = ULVT - example: doc-to-concept similarity matrix retrieval CS-concept inf. lung MD-concept brain data CS x x = MD
SVD - Example • A = ULVT - example: retrieval ‘strength’ of CS-concept inf. lung brain data CS x x = MD
SVD - Example • A = ULVT - example: term-to-concept similarity matrix retrieval inf. lung brain data CS-concept CS x x = MD
SVD – Dimensionality reduction • Q: how exactly is dim. reduction done? • A: set the smallest singular values to zero: x x =
Best-fit regression line reduces data from two dimensions into one. Regression line along second dim. captures less variation in original data.
Properties of SVD • Patterns among the attributes are captured by right singular vectors i.e. the columns of V • Patterns among the objects are captured by the left singular vectors i.e. the columns of U • The larger the singular value, the larger the fraction of a matrix that is accounted for by the singular value and its associated singular vector