Download
1 / 11
110 likes | 199 Views
This study analyzes the influence of memory size on ECM and E2CM performance in single-hop high degree hotspots. Various metrics such as port throughput, queue length, flow completion time, dropped frames, and more were evaluated. The findings demonstrate the impact of memory size on system performance and shed light on the resiliency and stability of CM schemes.

E N D
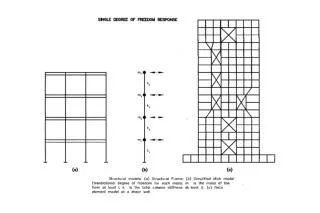
Impact of memory size on ECM and E2CM Single-Hop High Degree Hotspot Cyriel Minkenberg & Mitch Gusat IBM Research GmbH, Zurich May 10, 2007
Targets • Determine impact of memory size on performance • Simulated sizes: 75, 150, 300 KB per port • ECM, E2CM • PAUSE on/off • BCN(0,0) on/off • Metrics • Aggregate & hot port throughput • Hot queue length • Mean flow completion time, number of flows completed • Number of frames dropped IBM Research GmbH, Zurich
Output-Generated Single-Hop High HSD • All nodes: Uniform destination distribution, load = 85% (8.5 Gb/s) • Node 1 service rate = 10% Node 2 85% Service rate = 10% Core Switch N= 16 Node 1 85% 85% Node N IBM Research GmbH, Zurich
Traffic Bernoulli Uniform destination distribution (to all nodes except self) Fixed frame size = 1500 B Scenario Single-hop output-generated hotspot Switch Radix N = 16 M = [75, 150, 300] KB/port Link time of flight = 1 us Partitioned memory per input, shared among all outputs No limit on per-output memory usage PAUSE enabled or disabled Applied on a per input basis based on local high/low watermarks watermarkhigh = M – rtt*bw KB watermarklow = M – rtt*bw KB If disabled, frames dropped when input partition full Adapter Per-node virtual output queuing, round-robin scheduling No limit on number of rate limiters Ingress buffer size = infinite, round-robin VOQ service Egress buffer size = 150 KB PAUSE enabled watermarkhigh = 150 – rtt*bw KB watermarklow = watermarkhigh - 10 KB ECM W = 2.0 Qeq = M/4 Gd = 0.5 / ((2*W+1)*Qeq) Gi0 = (Rlink / Runit) * ((2*W+1)*Qeq) Gi = 0.1 * Gi0 Psample = 2% (on average 1 sample every 75 KB Runit = Rmin = 1 Mb/s BCN_MAX enabled, threshold = M KB BCN(0,0) dis/enabled, threshold = 4*M KB Drift enabled E2CM (per-flow) W = 2.0 Qeq,flow = M/20 KB Gd, flow = 0.5 / ((2*W+1)*Qeq,flow) Gi, flow = 0.005 * (Rlink / Runit) / ((2*W+1)*Qeq,flow) Psample = 2% (on average 1 sample every 75 KB) Runit = Rmin = 1 Mb/s BCN_MAX enabled, threshold = M/5 KB BCN(0,0) dis/enabled, threshold = 4*M/5 KB Simulation Setup & Parameters (same as before) IBM Research GmbH, Zurich
Aggregate throughput ECM w/o PAUSE E2CM w/o PAUSE ECM w/ PAUSE E2CM w/ PAUSE IBM Research GmbH, Zurich
Hot port throughput ECM w/o PAUSE E2CM w/o PAUSE ECM w/ PAUSE E2CM w/ PAUSE IBM Research GmbH, Zurich
Hot port queue length ECM w/o PAUSE E2CM w/o PAUSE ECM w/ PAUSE E2CM w/ PAUSE IBM Research GmbH, Zurich
Number of frames dropped (no PAUSE) • E2CM drops fewer frames IBM Research GmbH, Zurich
Number of flows completed • When either PAUSE or BCN(0,0) are enabled numbers are virtually identical • Without PAUSE and BCN(0,) E2CM tends to do somewhat better IBM Research GmbH, Zurich
Mean flow completion time • Larger memory shorter flow completion time • ECM with PAUSE tends to perform worst • With largest memory, E2CM has about 20% lower FCT than ECM IBM Research GmbH, Zurich
Conclusions • Chairman has raised the issue of more realistic (shallow) on-chip buffers • Will our CM schemes still work – and how well? • Findings: Baseline ECM and E2CM show robust performance even with reduced memory • Resilience: Both loops have sufficient stability phase margin built in • Performance is comparable, E2CM sometimes better IBM Research GmbH, Zurich