Download
1 / 19
190 likes | 357 Views
Motion. D-T Graphs. Measuring Motion. Discuss the following What is speed? How is it related to distance and time?. Distance versus Time Graphs. D-t graphs show what distance travelled for a particular length of time. The gradient of the d-t graphs indicate the speed of the object.

E N D
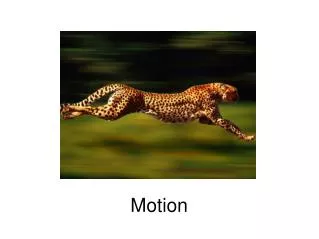
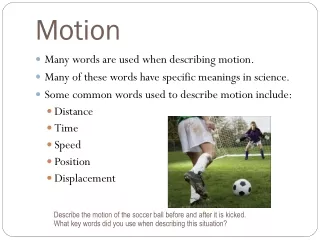
Measuring Motion • Discuss the following • What is speed? • How is it related to distance and time?
Distance versus Time Graphs • D-t graphs show what distance travelled for a particular length of time. • The gradient of the d-t graphs indicate the speed of the object. • Gradient = vertical rise / hoizontal run • OR • Speed = d2 - d1 t2 - t1 Graph shows constant speed
Distance versus Time Graphs Graph shows non-constant speed - ACCELERATION Graph shows zero speed What would the graph for deceleration look like?
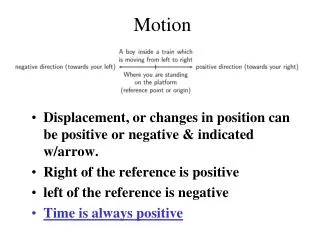
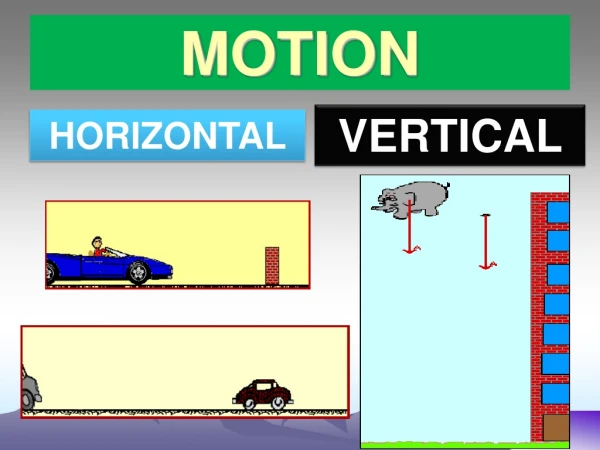
Measuring Motion DISTANCEis the total length of a path followed and is measured usually in metres (m). Other units of measurement for distance are centimetres (cm) or kilometres (km). DISPLACEMENT is the distance between the initial and final position
Can you convert to metres 32 kilometres equals • 0.032 metres • 320 metres • 3200 metres • B. 32000metres
Measuring Motion TIME – is also needed to measure motion. It is usually measured in seconds (s). Other units of time are minutes (min) and hour (h). Can you convert • 120 sec into minutes ? Divide by 60 • 30 min into sec? • Multiply by 60 • 3000 sec into hours ? Divide by 60 then Divide by 60
Measuring Motion SPEED – is is the distance an object travels over a certain amount of time. SPEED = Distance divided by time OR Distance SPEED = Time Units for speed are metres per second (m/s) or kilometres per hour (km/h)
Measuring Motion A plane travels a distance of 220 km in 2 hours. What is its speed? Distance (km) SPEED = Time (h) = 220 2 = 110 km/h Can you find the speed in m/s? Clue: Convert to metres and seconds before you convert
Measuring Motion VELOCITY – is defined as the speed and direction of an object. A plane travels a distance of 220 km in 2 hours. The plane is travelling due North. What is its velocity? Speed = 110km/h Velocity = 110 km/h due North
ACTIVITY Questions 1, 2, 3, 4, 5, 6, 7, 8 on page 116-117 of text.
Speed versus Time Graphs • S-t graphs show the speed of an object at a particular time. • The gradient of the s-t graphs gives the acceleration. • Gradient = vertical rise / hoizontal run • OR • Speed = v2 - v1 t2 - t1 Graph shows constant acceleration.
Speed versus Time Graphs Graph shows negative acceleration or deceleration. Graph shows no acceleration You can find the distance travelled in an s-t graph by calculating the area under the graph.
Finding distance using s-t graphs 2 3 1 You can find the distance traveled in a s-t graph by calculating the area under the graph.Distance = Area 1 + Area 2 + Area 3 = (½ x 10 x 10) + (10 X 10) + (½ x 10 x 10) = 50 + 100 + 50 = 200 m
Measuring Motion Constant speed is when the object travels the same distance over the same amount of time i.e. this means zero acceleration. Cars, trucks, trains and bicycles rarely travel at constant speed for very long. The speed usually increases or decreases as it moves. In this case we talk about AVERGE SPEED. AVERAGE SPEED = DISTANCE TRAVELLED TIME
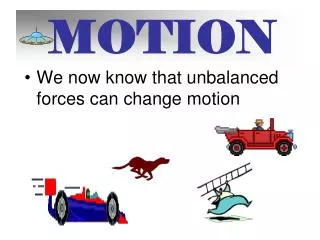
Acceleration – is the rate at which speed changes. An increase in speed is called acceleration or positive acceleration. A decrease in speed is called deceleration or negative acceleration Constant speed has ____________ acceleration. Change in speed (m/s) ACCELERATION = Time taken (s) = Final speed – Initial speed Time taken Acceleration is measured in metres per second per second or m/s2
Example A car starts from rest and increases speed up to 3 m/s in 5 seconds. What is its acceleration? Acceleration = final speed – initial speed Time taken = 3-0 5 = 0.6 m/s2
ACTIVITY Questions 1, 3, 4, 5, 6,7, 8, 9 10 and 11 on page 125-126 of text.