Download
1 / 43
440 likes | 546 Views
Introduction to Bioinformatics Microarrays 3: Data Clustering. Course 341 Department of Computing Imperial College, London Moustafa Ghanem Yike Guo. Data Clustering Lecture Overview. Introduction: What is Data Clustering Key Terms & Concepts Dimensionality Centroids & Distance

E N D
Introduction to BioinformaticsMicroarrays 3: Data Clustering Course 341 Department of Computing Imperial College, London Moustafa Ghanem Yike Guo
Data ClusteringLecture Overview • Introduction: What is Data Clustering • Key Terms & Concepts • Dimensionality • Centroids & Distance • Distance & Similarity measures • Data Structures Used • Hierarchical & non-hierarchical • Hierarchical Clustering • Algorithm • Single/complete/average linkage • Dendrograms • K-means Clustering • Algorithm • Other Related Concepts • Self Organising Maps (SOM) • Dimensionality Reduction: PCA & MDS
Gene Expression Matrix Samples Genes Gene expression levels IntroductionAnalysis of Gene Expression Matrices • In a gene expression matrix, rows represent genes and columns represent measurements from different experimental conditions measured on individual arrays. • The values at each position in the matrix characterise the expression level (absolute or relative) of a particular gene under a particular experimental condition.
IntroductionIdentifying Similar Patterns • The goal of microarray data analysis is to find relationships and patterns in the data to achieve insights in underlying biology. • Clustering algorithms can be applied to the resulting data to find groups of similar genes or groups of similar samples. • e.g. Groups of genes with “similar expression profiles (Co-expressed Genes) --- similar rows in the gene expression matrix • or Groups of samples (disease cell lines/tissues/toxicants) with “similar effects” on gene expression --- similar columns in the gene expression matrix
IntroductionWhat is Data Clustering • Clustering of data is a method by which large sets of data is grouped into clusters (groups) of smaller sets of similar data. • Example: There are a total of 10 balls which are of three different colours. We are interested in clustering the balls into three different groups. • An intuitive solution is that balls of same colour are clustered (grouped together) by colour • Identifying similarity by colour was easy, however we want to extend this to numerical values to be able to deal with gene expression matrices, and also to cases when there are more features (not just colour).
IntroductionClustering Algorithms • A clustering algorithm attempts to find natural groups of components (or data) based on some notion similarity over the features describing them. • Also, the clustering algorithm finds the centroid of a group of data sets. • To determine cluster membership, many algorithms evaluate the distance between a point and the cluster centroids. • The output from a clustering algorithm is basically a statistical description of the cluster centroids with the number of components in each cluster.
Gene Expression Matrix Samples Genes Gene expression levels Key Terms and ConceptsDimensionality of gene expression matrix • Clustering algorithms work by calculating distances (or alternatively similarity in higher-dimensional spaces), i.e. when the elements are described by many features (e.g. colour, size, smoothness, etc for the balls example) • A gene expression matrix of N Genes x M Samples can be viewed as: • N genes, each represented in an M-dimensional space. • M samples, each represented in N-dimensional space • We will show graphical examples mainly in 2-D spaces • i.e. when N= 2 or M=2
centroid gene A + + + + + + + + + + + + + + + + + + + + + + + + + gene B Key Terms and ConceptsCentroid and Distance • In the first example (2 genes & 25 samples) the expression values of 2 Genes are plotted for 25 samples and Centroid shown) • In the second (2 genes & 2 samples) example the distance between the expression values of the 2 genes is shown
Key Terms and ConceptsCentriod and Distance Cluster centroid : The centroid of a cluster is a point whose parameter values are the mean of the parameter values of all the points in the clusters. Distance: Generally, the distance between two points is taken as a common metric to assess the similarity among the components of a population. The commonly used distance measure is the Euclidean metric which defines the distance between two points p= ( p1, p2, ....) and q = ( q1, q2, ....) is given by :
Key Terms and ConceptsProperties of Distance Metrics • There are many possible distance metrics. • Some theoretical (and intuitive) properties of distance metrics • Distance between two profiles must be greater than or equal to zero, distances cannot be negative. • The distance between a profile and itself must be zero • Conversely if the difference between two profiles is zero, then the profiles must be identical. • The distance between profile A and profile B must be the same as the distance between profile B and profile A. • The distance between profile A and profile C must be less than or equal to the sum of the distance between profiles A and B and profiles Ba and C.
(x2,y2) (x1, y1) Key Terms and ConceptsDistance/Similarity Measures • Euclidean (L2) distance • Manhattan (L1) distance • Lm: (|x1-x2|m+|y1-y2|m)1/m • L∞: max(|x1-x2|,|y1-y2|) • Inner product: x1x2+y1y2 • Correlation coefficient • Spearman rank correlation coefficient • For simplicity we will concentrate on Euclidean and Manhattan distances in this course
x 3 y 4 Key Terms and Concepts Examples of Minkowski Metrics
Key Terms and ConceptsDistance/Similarity Matrices • Gene Expression Matrix • N Genes x M Samples • Clustering is based on distances, this leads to a new useful data structure: • Similarity/Dissimilarity matrix • Represents the distance between either N Genes (NxN) or M Samples (MxM) • Only need half the matrix, since it is symmetrical
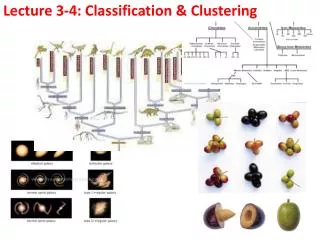
Key TermsHierarchical vs. Non-hierarchical • Hierarchical clustering is the most commonly used methods for identifying groups of closely related genes or tissues. Hierarchical clustering is a method that successively links genes or samples with similar profiles to form a tree structure – much like phylognentic tree. • K-means clustering is a method for non-hierarchical (flat) clustering that requires the analyst to supply the number of clusters in advance and then allocates genes and samples to clusters appropriately.
Hierarchical ClusteringAlgorithm • Given a set of N items to be clustered, and an NxN distance (or similarity) matrix, the basic process hierarchical clustering is this: • Start by assigning each item to its own cluster, so that if you have N items, you now have N clusters, each containing just one item. • Find the closest (most similar) pair of clusters and merge them into a single cluster, so that now you have one less cluster. • Compute distances (similarities) between the new cluster and each of the old clusters. • Repeat steps 2 and 3 until all items are clustered into a single cluster of size N.
Hierarchical Cluster Analysis • Scan matrix for minimum
2 3 Hierarchical Cluster Analysis • Scan matrix for minimum • Join genes to 1 node
2 3 Hierarchical Cluster Analysis • Update matrix
1 2 3 Hierarchical Cluster Analysis • Scan matrix for minimum • Join genes to 1 node
Average distance Min distance Max distance Hierarchical ClusteringDistance Between Two Clusters • Single-Link Method / Nearest Neighbor • Complete-Link / Furthest Neighbor • Their Centroids. • Average of all cross-cluster pairs. Whereas it is straightforward to calculate distance between two points, we do have various options when calculating distance between clusters.
Key TermsLinkage Methods for hierarchical clustering • Single-link clustering (also called the connectedness or minimum method) : we consider the distance between one cluster and another cluster to be equal to the shortest distance from any member of one cluster to any member of the other cluster. If the data consist of similarities, we consider the similarity between one cluster and another cluster to be equal to the greatest similarity from any member of one cluster to any member of the other cluster. • Complete-link clustering (also called the diameter or maximum method): we consider the distance between one cluster and another cluster to be equal to the longest distance from any member of one cluster to any member of the other cluster. • Average-link clustering we consider the distance between one cluster and another cluster to be equal to the average distance from any member of one cluster to any member of the other cluster.
Single-Link Method Euclidean Distance a a,b b a,b,c a,b,c,d c d c d d (1) (3) (2) Distance Matrix
Complete-Link Method Euclidean Distance a a,b a,b b a,b,c,d c,d c d c d (1) (3) (2) Distance Matrix
0 2 4 6 Single-Link Complete-Link Key Terms and ConceptsDendrograms and Linkage The resulting tree structure is usally referred to as a dendrogram. In a dendrogram the length of each tree branch represents the distance between clusters it joins. Different dendrograms may arise when different Linkage methods are used
Two Way Hierarchical Clustering Note we can do two way clustering by performing clustering on both the rows and the columns It is common to visualise the data as shown using a heatmap. Don’t confuse the heatmap with the colours of a microarray image. They are different ! Why?
K-Means Clustering • Basic Ideas : using cluster centroids (means) to represent cluster • Assigning data elements to the closet cluster (centroid). • Goal: Minimise square error (intra-class dissimilarity)
1) Select an initial partition of k clusters 2) Assign each object to the cluster with the closest centroid 3) Compute the new centeroid of the clusters: 4) Repeat step 2 and 3 until no object changes cluster K-means ClusteringAlgorithm
k-means Clustering: Procedure (1) Step 1a Specify the number of cluster k e.g, k = 4 Each point is called “gene”
k-means Clustering: Procedure (2) Step 1b Assign k random centroids
[(6,7) + (3,4) + …] k-means Clustering: Procedure (3) Step 1c Calculate the centroid (mean) of each cluster (6,7) (3,4) (3,2) (1,2)
Gene i to cluster c k-means Clustering: Procedure (4) Step 2 Each gene is reassigned to the nearest cluster
k-means Clustering: Procedure (5) Step 3 Calculate the centroid (mean) of each cluster
k-means Clustering : Procedure (5) Step 4 Iterate until the means are converged
ComparisonK-means vs. Hierarchical Clustering • Computation Time • Hierarchical clustering: O( m n2 log(n) ) • K-means clustering: O( k t m n ) • t: number of iterations • Memory Requirements • Hierarchical clustering: O( mn + n2 ) • K-means clustering: O( mn + kn ) • t: number of iterations • Other • Hierarchical Clustering: Need to select Linkage Method, and then a sensible split threshold • K-means: Need to select K • In both cases: Need to select distance/similarity measure
Other Related ConceptsSelf Organising Maps • Self Organising Maps (SOM) algorithm is similar to k-means in that the user specifies a predefined number of clusters as a seed. • However, as opposed to k-means, the clusters related to another via a spatial topology --- Usually the clusters are arranged in a square or hexagonal grid. • Initially, elements are allocated to the clusters at random. The algorithm iteratively recalculates the cluster centroids based on the elements assigned to each cluster as well as those assigned to its neighbours, and then re-allocates the data elements to the clusters. • Since the clusters are spatially related, neighbouring clusters can generally be merged at the end of a run based on a threshold value.
If you take genes to be dimensions, you may end up with up to 30,000 dimensions describing each sample ! Other Related ConceptsDimensionality Reduction • Clustering of data is a form of data reduction since it allows us to describe large data sets (large number of points) into smaller sets. • A related concept is that of dimensionality reduction. • Each point in a data set is a point in a large multi-dimensional space (Dimension can either by genes or samples) • Dimensionality reduction methods aim to map the same data points to a lower dimensional space (e.g. 2-D or 3-D) that preserves their inter-relationships. • Dimensionality reduction methods are very useful for data visualisation, and also as a pre-processing step before applying data analysis algorithms such as clustering or classification that cannot cope with a very large number of dimensions. • The maths behind these methods is beyond this course, and the following slides introduce only the basic idea.
Dimensionality ReductionMulti-dimensional Scaling (MDS) • MDS algorithms work by finding co-ordinates in 2-D or 3-D space that preserve the distance ranking between the points in the high dimensional space. • The staring point of MDS algorithm is the distance or similarity matrix between the data points and work through an optimisation algorithm. • MDS preserve the notion of nearness, and therefore clusters in the high dimensional space still look like cluster on an MDS plot.
Dimensionality ReductionPrincipal Component Analysis (PCA) • PCA aims to identify the direction(s) of greatest variation of the data. • Conceptually this is as if you rotate the data to find the 1st dimension of greatest variation, then the 2nd, … • Once the 1st dimension is found, a recursive procedure is applied on the remaining dimensions. • The resulting PCA dimensions ordered: first dimension captures most of the variation, second dimension captures most of the remaining variation, etc. • PCA algorithms work using linear algebra (by calculating Eigen vectors) • After calculating all the PCA components, you keep only the top-k components. In general the first few can usually capture about 90% of the variation of the data
Summary • Clustering algorithms used to find similarity relationships between genes, diseases, tissue or samples • Different similarity metrics can be used – mainly Euclidean and Manhattan) • Hierarchical clustering • Similarity matrix • Algorithm • Linkage methods • K-means clustering algorithm • SOM, MDS, and PCA (only for reference)