Download
1 / 19
190 likes | 289 Views
Dynamic Quick View, interoperability and the future. Jon Blower, Keith Haines, Chunlei Liu, Alastair Gemmell Environmental Systems Science Centre University of Reading United Kingdom. Introduction. We have developed an interactive website and map server for data visualization

E N D
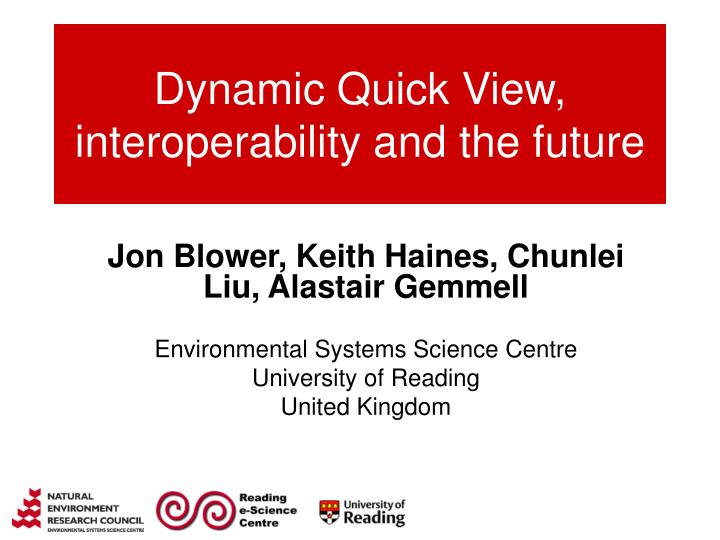
Dynamic Quick View, interoperability and the future Jon Blower, Keith Haines, Chunlei Liu, Alastair Gemmell Environmental Systems Science Centre University of Reading United Kingdom
Introduction • We have developed an interactive website and map server for data visualization • work originated in UK e-Science programme and National Centre for Ocean Forecasting • Takes advantage of freely-available Web GIS tools • We have integrated our prototype with the MERSEA system (via OPeNDAP) • not yet an approved MERSEA service • We hope to demonstrate the exciting potential of this system and benefits of adherence to open standards • Will be very important in INSPIRE • Potential use is much wider than marine science
Dynamic Quick View (DQV) Service • Gives very fast previews of 4-D data on an interactive website • Reads data from OPeNDAP servers at the MERSEA TEPs • Draggable, zoomable map • Allows the fast creation of animations • Based on a standards-compliant Web Map Service
Selection of depth Select from all the depth levels of the model
Selection of time (range) Select from all the timesteps in the model Selection of a time range leads to an animation
Finding the data value at a point Click on the data layer, data value and precise position is shown Lon: -64.08 Lat: 36.21 Value: 19.27
Timeseries plots If a time range is selected, can create a timeseries plot at a point
Export to Google Earth • DQV website contains link to load currently-visible data into Google Earth • Our WMS outputs in KMZ format • Can then view data alongside other KML datasets • e.g. DAMOCLES • Can view animations of data • No problem with map projections!
Visualize alongside third-party data • Hurricane Katrina, August 2005 • Showing sea surface temperature (UK Met Office) and storm position/intensity (ECMWF) • Winds cause upwelling of cooler subsurface water on right-hand side of the cyclonic storm track
Selection of non-MERSEA datasets also available OSTIA (GHRSST-PP): SST and sea ice high res (1/20°) NSIDC Snow-water equiv. (non-NetCDF) ECMWF System 3 Reanalysis Everything on the website can be exported to Google Earth
The Web Map Service • DQV website is built on a custom-made WMS • backwards-compatible with OGC spec, version 1.3.0 • Optimized for fast, dynamic generation of map images • Enhancements to allow changing of colour scale, generation of timeseries plots, etc • Reads data from CF-NetCDF files or OPeNDAP servers • reading directly from NetCDF is more efficient WMS OPeNDAP NetCDF
Important features of our WMS implementation • Fast generation of images • Handling of four-dimensional data • Handling of data on unusual grids, e.g. NEMO • Dynamic change of colour scale extent • Generation of animations • Export to Google Earth
Current DQV architecture: centralized Background imagery (from NASA etc) NetCDF NetCDF NetCDF TEP 2 TEP 1 TEP 3 OPeNDAP OPeNDAP OPeNDAP WMS Requires minimal setup Single point of failure Relies on fast, reliable OPeNDAP servers DQV website
Possible future DQV architecture: federated Background imagery (from NASA etc) Third-party WMS TEP 1 NetCDF TEP 2 NetCDF TEP 3 NetCDF OPeNDAP WMS OPeNDAP WMS OPeNDAP WMS Requires each TEP to install WMS No single point of failure More efficient DQV website
MERSEA data in third-party clients NASA World Wind Cadcorp SIS Google Earth
In-situ data • Picture left shows comparison of NEMO model and observations for Nov 2004 • Red dots show bad model-obs fits, green dots are good fits • Google Earth allows very efficient browsing of these large datasets • Could do the same for MERSEA systems, e.g. CORIOLIS • Could read obs and model data from different sources and bring together in Google Earth or another client
DQV future enhancements • Display of wind/current fields as vectors • Caching of image tiles for performance increase • Support for more map projections • E.g. polar stereographic • Display of observations on website • Integration with GeoServer, THREDDS • Requires community assistance • …Lots more!
Conclusions • We have demonstrated a dynamic website for exploring MERSEA data quickly and interactively • Based on an OGC Web Map Service • but with important enhancements • other WMS implementations will not support all the features in DQV • Gives interoperability with third-party services • view MERSEA data alongside third-party data • will be important in INSPIRE • Exciting possibilities for the future!
Contact details jdb@mail.nerc-essc.ac.uk To find website: Google for "Godiva2"