Download
1 / 60
600 likes | 718 Views
A Conceptual Approach to Prioritizing Landscapes for Fuels Treatments in Northern Spotted Owl Habitats. Acknowledgements Scott Center Cindy Donegan Lynn Gemlo. Problem Statement.

E N D
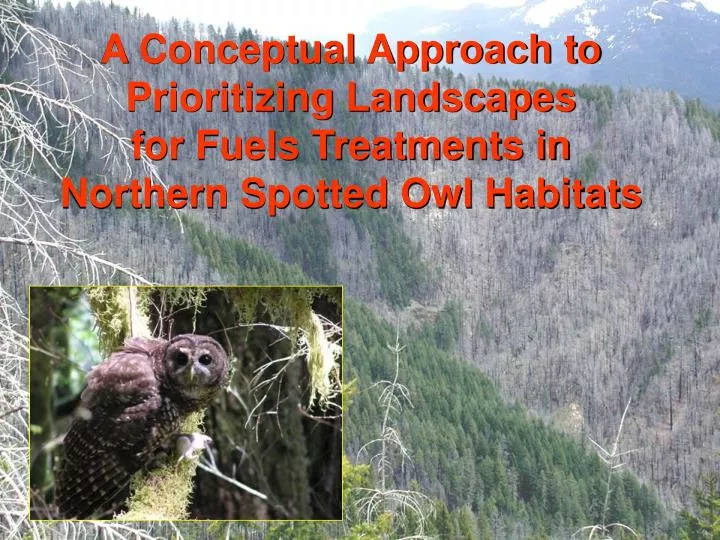
A Conceptual Approach to Prioritizing Landscapes for Fuels Treatments in Northern Spotted Owl Habitats
Problem Statement The paradox facing land managers today is the need to treat northern spotted owl habitat in order to save it (Agee 1992).To achieve this, we need to identify priority areas for reducing the risk of stand replacement wildfires in areas with high habitat values.
Conceptual Model Resource Values Risk Factors One to many One to many Composite Risk Map Composite Values Map Landscape Prioritization Map
Northern Spotted Owl and the Northwest Forest Plan • 18.1 million acres of habitat • capable Federal land • 9.3 million acres of habitat • Declining populations • Habitat at risk
Lightning Ignited Wildfire during the First Decade (1994-2003) 50% were caused by lightning 75% of the total area burned was the result of lightning Around 13,200 wildfires were recorded on Federal lands, burning about 1.7 million acres
Wildfire Density Map ( # Fires / 100 mi²) Moderate Density Low Density High Density
Largest Wildfires ( first decade ) >15,000 acres in WA B&B Complex >10,000 acres in OR Tiller Complex Biscuit Fire >5,000 acres in CA
Resulting in Loss of Habitat ( first decade ) 1% Habitat Loss ( East Cascades ) 1% Habitat Loss ( West Cascades) 7% Habitat Loss ( Klamath ) 230,000 acres of habitat were lost range wide to wildfire in the 1st decade. About a 1.3% decrease across the range. About 5x as much than was lost from clearcut timber harvesting.
Declining Stationary Spotted Owl Population Trends ( Anthony et al. 2005 ) NSO Demography Areas
Conceptual Landscape Analysis Area • Southwestern Oregon • Stationary populations • Active wildfire history
Analysis Area Location Map Southern Oregon Coastal Basin ( HUC 3 ) 8.2 million total acres 41% Federal land Coos Bay Roseburg Grants Pass Medford Ashland
Analysis Area Location Map USFS = 2,039,431 ac BLM = 1,292,492 ac NPS = 36,639 ac Coos Bay Roseburg Grants Pass Medford Ashland
Conceptual Model Spotted Owl Elements Wildfire Elements Crown Fire Potential Reserved Allocations Wildfire Density Critical Habitat Habitat Connectivity Condition Class Owl Presence Composite Risk Map Composite Values Map Landscape Prioritization Map
WILDFIRE ELEMENTS
Crown Fire Modeling ( FlamMap 3.0 ) Crown Fire Potential High Moderate Low
Crown Fire Modeling ( FlamMap 3.0 ) Crown Fire Potential High Moderate Low Fire “Validation”
Crown Fire Potential ( binary map - 0 or 1 )
Lightning Ignitions ( 1970-2002 )
Lightning Ignition Density ( 1970-2002 ) High density
Wildfire Density ( binary map - 0 or 1 )
Fire Regime – Condition Class ( Landfire Rapid Assessment ) Condition Class 3 Condition Class 2 Condition Class 1
SPOTTED OWL ELEMENTS SPOTTED OWL ELEMENTS
NSO Critical Habitat Units ( binary map – 0 or 1 ) USFWS 1992
NWFP Reserved Allocations ( binary map – 0 or 1 ) FEMAT 1994
NSO Habitat Connectivity ( binary map – 0 or 1 ) Lint et al. 2005
NSO Owl Pair Territories ( binary map – 0 or 1 ) Lint et al. 2005
Crown Fire Potential Wildfire Density Condition Class Fire Risk Composite Map
Critical Habitat Reserved Habitat Habitat Connectivity Owl Presence Habitat Value Composite Map
Combined Composite Map Moderate Fire Risk & Medium Habitat Value High Fire Risk & High Habitat Value Lower Fire Risk & Low Habitat Value High Priority Protection Lower Priority Protection
Amount of Prioritized Treatment Acres Within Analysis Area
Application Cow Creek Project
29,000 acres • Tiller Ranger District • Umpqua National Forest
. Myrtle Creek Shady Cove Canyonville Glendale Riddle McCleod Azalea Days Creek Wolf Creek Tiller Trail Drew Milo 0 10 20 miles Fortune Branch
. 0 10 20 miles USFS BLM
. Large wildfires (1974-2002) 0 10 20 miles
. 0 10 20 miles
. Large wildfires (1900-1930) 0 10 20 miles
. Spotted owl habitat 0 10 20 miles
. Spotted owl critical habitat 0 10 20 miles Critical habitat unit Critical habitat unit
. Late-successional reserves 0 10 20 miles
. Urban interface/intermix 0 10 20 miles
. Recent fires (1974-2002)
. Historic fires (1936 forest map) recently burned seedling /sapling small trees
. Fire modeling (terrain)
. Fire modeling (current situation)