Download
1 / 72
720 likes | 866 Views
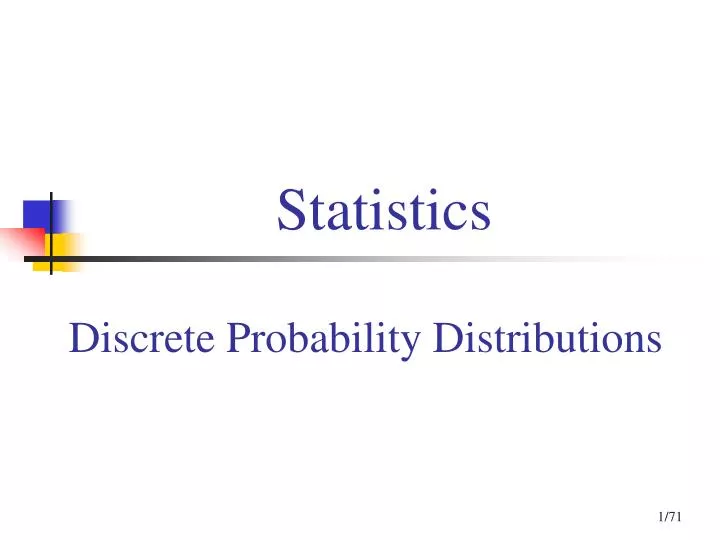
Statistics. Discrete Probability Distributions. .40. .30. .20. .10. 0 1 2 3 4. Contents. Random Variables. Discrete Probability Distributions. Expected Value and Variance. Binomial Distribution. Poisson Distribution. Hypergeometric Distribution.

E N D
Statistics Discrete Probability Distributions
.40 .30 .20 .10 0 1 2 3 4 Contents • Random Variables • Discrete Probability Distributions • Expected Value and Variance • Binomial Distribution • Poisson Distribution • HypergeometricDistribution
STATISTICSin PRACTICE • Citibank makes available a wide range of financial services. • Citibanking’s automatic teller machines (ATMs) located in Citicard Banking Centers (CBCs), let customers do all their banking in one place with the touch of a finger.
STATISTICSin PRACTICE • Periodic CBC capacity studies are used to analyze customer waiting times and to determine whether additional ATMs are needed. • Data collected by Citibank showed that the random customer arrivals followed a probability distribution known as the Poisson distribution.
Random Variables • A random variable is a numerical • description of the outcome of an experiment. • A discrete random variable may assume • either a finite number of values or an infinite • sequence of values. • A continuous random variable may assume • any numerical value in an interval or • collection of intervals.
Differences between outcomes and random variables • Example: Tossing a dice • Possible outcomes: 1, 2, 3, 4, 5, and 6 • One can define random variables as • 1 if outcome is greater than 3, and • 0 if outcome is smaller or equal to 3. • Or • 1 if outcome is odd numbers • 0 if outcome is even numbers
Discrete Random Variables • Example 1. The certified public accountant (CPA) examination has four parts. Define a random variable as x = the number of parts of the CPA examination passed and It is a discrete random variable because it may assume the finite number of values 0, 1, 2, 3, or 4.
Discrete Random Variables Example 2. An experiment of cars arriving at a tollbooth. The random variable is x = the number of cars arriving during a one-day period. The possible values for x come from the sequence of integers 0, 1, 2, and so on. x is a discrete random variable assuming one of the values in this infinite sequence.
Discrete Random Variables • Examples of Discrete Random Variables
Example: JSL Appliances • Discrete random variable with a finite number of values Let x = number of TVs sold at the store in one day, where x can take on 5 values (0, 1, 2, 3, 4)
Example: JSL Appliances • Discrete random variable with an infinite sequence of values Let x = number of customers arriving in one day, where x can take on the values 0, 1, 2, . . . We can count the customers arriving, but there is no finite upper limit on the number that might arrive.
Random Variables Type Question Random Variable x Family size x = Number of dependents reported on tax return Discrete Continuous x = Distance in miles from home to the store site Distance from home to store Own dog or cat Discrete x = 1 if own no pet; = 2 if own dog(s) only; = 3 if own cat(s) only; = 4 if own dog(s) and cat(s)
ContinuousRandom Variables Example 1. Experimental outcomes based on measurement scales such as time, weight, distance, and temperature can be described by continuous random variables.
ContinuousRandom Variables Example 2. An experiment of monitoring incoming telephone calls to the claims office of a major insurance company. Suppose the random variable of interest is x = the time between consecutive incoming calls in minutes. This random variable may assume any value in the interval x≥ 0.
ContinuousRandom Variables • Example of Continuous Random Variables
Discrete Probability Distributions • The probability distribution for a random • variable describes how probabilities are • distributed over the values of the random • variable. • We can describe a discrete probability • distribution with a table, graph, or equation.
Discrete Probability Distributions • The probability distribution is defined by a • probability function, denoted by f(x), which • provides the probability for each value of • the random variable. The required conditions for a discrete probability function are: f(x) > 0 f(x) = 1
Discrete Probability Distributions • Example: Probability Distribution for the Number of Automobiles Sold During a Day at Dicarlo Motors.
Discrete Probability Distributions • Using past data on TV sales, … • a tabular representation of the probability distribution for TV sales was developed. xf(x) 0 .40 1 .25 2 .20 3 .05 4 .10 1.00 Number Units Soldof Days 0 80 1 50 2 40 3 10 4 20 200 80/200
.50 .40 .30 .20 .10 Discrete Probability Distributions • Graphical Representation of Probability Distribution Probability 0 1 2 3 4 Values of Random Variable x (TV sales)
Discrete Uniform Probability Distribution The discrete uniform probability distribution is the simplest example of a discrete probability distribution given by a formula.
Discrete Uniform Probability Distribution The discrete uniform probability function is the values of the random variable are equally likely f(x) = 1/n where: n = the number of values the random variable may assume
Discrete Uniform Probability Distribution • Example: An experiment of rolling a die we define the random variable x to be the number of dots on the upward face. There are n = 6 possible values for the random variable; x = 1, 2, 3, 4, 5, 6. The probability function for this discrete uniform random variable is f (x) = 1/6 x = 1, 2, 3, 4, 5, 6.
Discrete Uniform Probability Distribution x f (x) 1 1/6 2 1/6 3 1/6 4 1/6 5 1/6 6 1/6
Discrete Uniform Probability Distribution • Example: Consider the random variable x with the following discrete probability distribution. This probability distribution can be defined by the formula f (x) = x/ 10 for x = 1, 2, 3, or 4. x f (x) 1 1/10 2 2/10 3 3/10 4 4/10
E(x) = = x f(x) Var(x) = 2 = (x - )2f(x) Expected Value and Variance • The expected value, or mean, of a random • variable is a measure of its central location. • The variance summarizes the variability in the • values of a random variable.
Expected Value and Variance • The standard deviation, , is defined • as the positive square root of the variance. • Here, the expected value and variance • are computed from random variables • instead of outcomes
Expected Value and Variance • Example: Calculation of the Expected Value for the Number of Automobiles Sold During A Day at Dicarlo Motors.
Expected Value and Variance • Example: Calculation of the Variance for the Number of Automobiles Sold During A Day at Dicarlo Motors. The standard deviation is
Expected Value and Variance • Expected Value xf(x)xf(x) 0 .40 .00 1 .25 .25 2 .20 .40 3 .05 .15 4 .10 .40 E(x) = 1.20 expected number of TVs sold in a day
Expected Value and Variance • Variance and Standard Deviation x (x - )2 f(x) (x - )2f(x) x - -1.2 -0.2 0.8 1.8 2.8 1.44 0.04 0.64 3.24 7.84 0 1 2 3 4 .40 .25 .20 .05 .10 .576 .010 .128 .162 .784 TVs squared Variance of daily sales = s 2 = 1.660 Standard deviation of daily sales = 1.2884 TVs
Binomial Distribution • Four Properties of a Binomial Experiment • 1. The experiment consists of a sequence of n • identical trials. • 2. Two outcomes, success and failure, are possible • on each trial. 3. The probability of a success, denoted by p, does not change from trial to trial. stationarity assumption 4. The trials are independent.
Binomial Distribution • Our interest is in the number of successes • occurring in the n trials. • We let x denote the number of successes • occurring in the n trials.
Binomial Distribution • Binomial Probability Function where: f(x) = the probability of x successes in n trials, n = the number of trials, p = the probability of success on any one trial.
Binomial Distribution Number of experimental outcomes providing exactly x successes in n trials = Probability of a particular sequence of trial outcomes with x successes in n trials =
Binomial Distribution • Binomial Probability Function
Binomial Distribution • Example: The experiment of tossing a coin five times and on each toss observing whether the coin lands with a head or a tail on its upward face. we want to count the number of heads appearing over the five tosses. • Does this experiment show the properties of a binomial experiment?
Binomial Distribution • Note that: 1. The experiment consists of five identical trials; each trial involves the tossing of one coin. 2. Two outcomes are possible for each trial: a head or a tail. We can designate head a success and tail a failure.
Binomial Distribution • Note that: 3. The probability of a head and the probability of a tail are the same for each trial, with p = .5 and 1- p = .5. 4. The trials or tosses are independent because the outcomeon any one trial is not affected by what happens on other trials or tosses.
Binomial Distribution • Example: Evans Electronics Evans is concerned about a low retention rate for employees. In recent years, management has seen a turnover of 10% of the hourly employees annually. Thus, for any hourly employee chosen at random, management estimates a probability of 0.1 that the person will not be with the company next year.
Binomial Distribution • Using the Binomial Probability Function Choosing 3 hourly employees at random, what is the probability that 1 of them will leave the company this year? Let: p = .10, n = 3, x = 1
Binomial Distribution x 1st Worker 2nd Worker 3rd Worker Prob. • Tree Diagram L (.1) .0010 3 Leaves (.1) .0090 2 S (.9) Leaves (.1) L (.1) .0090 2 Stays (.9) 1 .0810 S (.9) L (.1) 2 .0090 Leaves (.1) Stays (.9) 1 .0810 S (.9) L (.1) 1 .0810 Stays (.9) 0 .7290 S (.9)
Binomial Distribution • Using Tables of Binomial Probabilities
Binomial Distribution • Expected Value E(x) = = np • Variance • Var(x) = 2 = np(1 -p) • Standard Deviation
Binomial Distribution • Expected Value E(x) = = 3(.1) = .3 employees out of 3 • Variance Var(x) = 2 = 3(.1)(.9) = .27 • Standard Deviation
Poisson Distribution • A Poisson distributed random variable is often • useful in estimating the number of occurrences • over a specified interval of time or space • It is a discrete random variable that may • assumean infinite sequence of values • (x = 0, 1, 2, . . . ).
Poisson Distribution • Examples of a Poisson distributed random variable: • the number of knotholes in 14 linear feet of • pine board • the number of vehicles arriving at a • toll booth in one hour
Poisson Distribution • Two Properties of a Poisson Experiment • The probability of an occurrence is the • same for any two intervals of equal length. • The occurrence or nonoccurrence in any • interval is independent of the occurrence • ornonoccurrence in any other interval.
Poisson Distribution • Poisson Probability Function where: f(x) = probability of x occurrences in an interval, = mean number of occurrences in an interval, e = 2.71828.
Poisson Distribution • Example: We are interested in the number of arrivals at the drive-up teller window of a bank during a 15-minute period on weekday mornings. Assume that the probability of a car arriving is the same for any two time periods of equal length and that the arrival or nonarrivalof a car in any time period is independent of the arrival or nonarrival in any other time period.