Download
1 / 48
510 likes | 812 Views
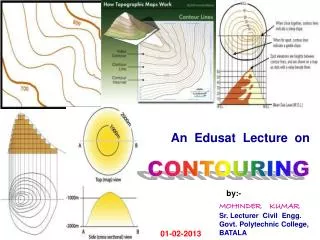
An Edusat Lecture on. CONTOURING. by:-. MOHINDER KUMAR Sr. Lecturer Civil Engg . Govt. Polytechnic College, BATALA. 01-02-2013. Contour An imaginary line on the ground surface joining the points of equal elevation is known as contour.

E N D
An Edusat Lecture on CONTOURING by:- MOHINDER KUMAR Sr. Lecturer Civil Engg. Govt. Polytechnic College, BATALA 01-02-2013
ContourAn imaginary line on the ground surface joining the points of equal elevation is known as contour. In other words, contour is a line in which the ground surface is intersected by a level surface obtained by joining points of equal elevation. This line on the map represents a contour and is called contour line. CONTOURING 2 2
Contour Map A map showing contour lines is known as Contour map. A contour map gives an idea of the altitudes of the surface features as well as their relative positions in plan serves the purpose of both, a plan and a section. CONTOURING 3 3
Contouring The process of tracing contour lines on the surface of the earth is called Contouring. CONTOURING 4 3
PURPOSE OF CONTOURING Contour survey is carried out at the starting of any engineering project such as a road, a railway, a canal, a dam, a building etc. i) For preparing contour maps in order to select the most economical or suitable site. ii) To locate the alignment of a canal so that it should follow a ridge line. iii) To mark the alignment of roads and railways so that the quantity of earthwork both in cutting and filling should be minimum. CONTOURING 5 4
PURPOSE OF CONTOURING (contd.) iv) For getting information about the ground whether it is flat, undulating or mountainous. v) To find the capacity of a reservoir and volume of earthwork especially in a mountainous region. vi) To trace out the given grade of a particular route. vii)To locate the physical features of the ground such as a pond depression, hill, steep or small slopes. CONTOURING 6
CONTOUR INTERVAL The constant vertical distance between two consecutive contours is called the contour interval. HORIZONTAL EQUIVALENT The horizontal distance between any two adjacent contours is called as horizontal equivalent. The contour interval is constant between the consecutive contours while the horizontal equivalent is variable and depends upon the slope of the ground. CONTOURING 7
FACTORS ON WHICH CONTOUR -INTERVAL DEPENDS The contour interval depends upon the following factors:- i)The Nature of the GroundIn flat and uniformly sloping country, the contour interval is small , but in broken and mountainous region the contour interval should be large otherwise the contours will come too close to each other. CONTOURING 8
FACTORS ON WHICH CONTOUR -INTERVAL DEPENDS ii) The Purpose and extent of the survey.Contour interval is small if the area to be surveyed is small and the maps are required to be used for the design work or for determining the quantities of earth work etc. while wider interval shall have to be kept for large areas and comparatively less important works. CONTOURING 9
FACTORS ON WHICH CONTOUR -INTERVAL DEPENDS iii)The Scale of the Map. The contour interval should be in the inverse ratio to the scale of the map i.e. the smaller the scale, the greater is the contour interval. iv)Time and Expense of Field and Office work. The smaller the interval, the greater is the amount of field-work and plotting work. CONTOURING 10
COMMON VALUES OF THE CONTOUR -INTERVAL The following are the common values of the contour interval adopted for various purposes:- • For large scale maps of flat country, for building sites, for detailed design work and for calculation of quantities of earth work; • 0.2 to 0.5 m. CONTOURING 11
COMMON VALUES OF THE CONTOUR -INTERVAL ii) For reservoirs and town planning schemes; 0.5 to 2m. iii) For location surveys. 2 to 3m. iv) For small scale maps of broken country and general topographic work; 3m,5m,10m,or25m. CONTOURING 12
CHARACTERISTICS OF CONTOURS i)All points in a contour line have the same elevation. ii) Flat ground is indicated where the …contours are widely separated and steep- slope where they run close together. iii)A uniform slope is indicated when the contour lines are uniformly spaced and iv) A plane surface when they are straight, parallel and equally spaced. CONTOURING 13
CHARACTERISTICS OF CONTOURS v)A series of closed contour lines on the map represent a hill , if the higher values are inside 80 75 70 65 HILL 60 60 65 70 75 80 A HILL CONTOURING 14
CHARACTERISTICS OF CONTOURS 80 vi) A series of closed contour lines on the map indicate adepression if the higher values are outside 75 DEPRESSION 70 65 60 70 60 65 70 75 80 A DEPRESSION CONTOURING 15
CHARACTERISTICS OF CONTOURS vii) Contour line cross ridge or valley line at right angles. If the higher values are inside the bend or loop in the contour, it indicates aRidge. 100 90 80 70 60 50 RIDGE LINE CONTOURING 16
CHARACTERISTICS OF CONTOURS vii) Contour line cross ridge or valley line at right angles. If the higher values are outside the bend, it represents aValley 100 90 80 70 60 50 VALLEY LINE CONTOURING 17
CHARACTERISTICS OF CONTOURS viii). Contours cannot end anywhere but close on themselves either within or outside the limits of the map. CONTOURING 18
CHARACTERISTICS OF CONTOURS ix). Contour lines cannot merge or cross one another on map except in the case of an overhanging cliff. 40 30 20 10 40 30 20 10 OVERHANGING CLIFF CONTOURING 19
CHARACTERISTICS OF CONTOURS x) Contour lines never run into one another except in the case of avertical cliff. In this case ,several contours coincide and the horizontal equivalent becomes zero. 50 40 30 VERTICAL CLIFF 20 10 50 10 20 30 40 50 OVERHANGING CLIFF CONTOURING 20
CHARACTERISTICS OF CONTOURS X Depressions between summits is called asaddle. It is represented by four sets of contours as shown. It represents a dip in a ridge or the junction of two ridges. And in the case of a mountain range ,it takes the form of a pass . 70 SADDLE 70 80 80 90 90 90 100 110 Line passing through the saddles and summits gives water shed line. CONTOURING 21
METHODS OF CONTOURING There are mainly two methods of locating contours:- (1)Direct Method and (2) Indirect Method. Direct Method: In this method, the contours to be located are directly traced out in the field by locating and marking a number of points on each contour. These points are then surveyed and plotted on plan and the contours drawn through them. 50 B.M 48 46 DIRECT METHOD OF CONTOURING CONTOURING 22
METHODS OF CONTOURING • Direct Method: • This method is most accurate but very slow and tedious as a lot of time is wastedin searching points of the same elevation for a contour. • This is suitable for small area and where great accuracy is required CONTOURING 23
Procedure: To start with, a temporary B.M is established near the area to be surveyed with reference to a permanent B.M by fly leveling. The level is then set up in such a position so that the maximum number of points can be commanded from the instrument station. The height of instrument is determined by taking a back sight on the B.M. and adding it to the R.L. of bench mark. The staff reading required to fix points on the various contours is determined by subtracting the R.L. of each of the contours from the height of instrument. CONTOURING 24
Example: If the height of instrument is 82.48m., then the staff readings required to locate 82, 81 and 80m contours are 0.48, 1.48 and 2.48m respectively. The staff is held on an approximate position of point and then moved up and down the slope until the desired reading is obtained. The point is marked with a peg. CONTOURING 25
Example(contd.): Similarly various other points are marked on each contour. The line joining all these points give the required contour. It may be noted that one contour is located at a time. Having fixed the contours within the range of the instrument, the level is shifted and set up in a new position. CONTOURING 26
Procedure (Contd…..) The new height of instrument and the required staff readings are then calculated in a similar manner and the process repeated till all the contours are located. The positions of the contour points are located suitably either simultaneous with levelling or afterwards. A theodolite , a compass or a plane table traversing is usually adopted for locating these points. The points are then plotted on the plan and the contours drawn by joining the corresponding points by dotted curved lines. CONTOURING 27
Direct Method By Radial Lines Lines: This method is suitable for small areas, where a single point in the centre can command the whole area.Radial lines are laid out from the common centre by theodolite or compass and their positions are fixed up by horizontal angles andbearings. 70 65 60 55 Fig.RADIAL LINES METHODOF CONTOURING CONTOURING 28
Direct Method By Radial Lines Lines (contd.): Temporary bench marks are first established at the centre and near the ends of the radial lines .The contour points are then located and marked on these lines and their positions are determined by measuring their distances along the radial lines. They are then plotted on the plan and the contours drawn by joining all the corresponding points with the help of a plane table instrument. CONTOURING 29
2. Indirect Method: In this method the points located and surveyed are not necessarily on the contour lines but the spot levels are taken along the series of lines laid out over the area .The spot levels of the several representative points representing hills, depressions, ridge and valley lines and the changes in the slope all over the area to be contoured are also observed. Their positions are then plotted on the plan and the contours drawn by interpolation. This method of contouring is also known as contouring by spot levels. CONTOURING 30
SQUARE METHOD CONTOURING 31
This method is commonly employed in all kinds of surveys as this is cheaper, quicker and less tedious as compared to direct method. There are mainly three method of contouring in indirect method: • (i) By Squares.In this method, the whole area is divided into number of squares, the side of which may vary from 5m to 30m depending upon the nature of the ground and the contour interval. The square need not be of the same size throughout. CONTOURING 31
2. Indirect Method: (Square Method) • The corners of the squares are pegged out and the reduced levels of these points are determined with a level. 100.4 97.60 96.05 94.40 13 14 15 16 98.00 98.00 98,00 97.45 99.25 98.75 99.40 9 12 98.65 99.60 97.80 89.55 5 8 98.0 99.0 99.0 100.90 99.70 99.85 98.45 123 4 CONTOURS INTERPOLATED SQURES LAID ON GROUND CONTOURING 32
2. Indirect Method: (Square Method) • The important points within the squares may be taken when required and located by measurements from the corners. The squares are plotted and the reduced levels of the corners are written on the plan. 100.4 97.60 96.05 94.40 98.00 98.00 98,00 97.45 99.25 98.75 99.40 98.65 99.60 97.80 89.55 98.0 99.0 99.0 100.90 99.70 99.85 98.45 SQUARE METHOD CONTOURING 33
2. Indirect Method: By Cross- Sections: This method is most suitable for the survey of long narrow strips such as a road, railway or canal etc. 70 70.6 69.1 68.8 69.1 70.8 69 69 70 RD 580 70.8 70.2 69.1 70.4 70.5 RD 560 71 71.2 70.8 66.3 70.6 70.8 DEPRESSION RD 540 67 71 68 69 70 RD 520 71.6 71.2 70.6 72.4 71.7 71 71 Fig. X-Section Method CONTOURING 34
2. Indirect Method: By Cross- Sections:This method is most suitable for the surveys of long narrow strips such as a road, railway or canal etc. Cross sections are run transverse to the centre line of the work and representative points are marked along the lines of cross-section. The cross-section lines need not necessarily be at right angles to the centre line of the work. This may be inclined at any angle to the centre line if necessary. The spacing of the cross-sections depends upon the topography of the country and the nature of the survey. CONTOURING 35
2. Indirect Method: By Cross- Sections: Thecommon value is 20 to 30 m in hilly countryand 100m in flat country. The levels of the points along the section lines are plotted on the plan and the contours are then interpolated as usual as shown in the fig. CONTOURING 36
2. Indirect Method: Fig. Stadia Wires at Diaphragm (iii) By Tacheometric method: A techeometer is a transit theodolite having a diaphragm fitted with two stadia wires, one above and other below the central wire. The horizontal distance between the instrument and staff station may be determined by multiplying the difference of the staff readings of the upper and lower stadia wires with the stadia constant of the instrument, which is usually 100.Thus the techeometer is used for both the vertical as well as horizontal measurements. CONTOURING 37
2. Indirect Method: iii) By Tacheometric method (contd…): This method is most suitable in hilly areas as the number of stations which can be commanded by a techeometer is far more than those by a level and thus the number of instrument settings are considerably reduced. A number of radial lines are laid out at a known angular interval and representative points are marked by pegs along these radial lines. Their elevations and distances are then calculated andplotted on the plan and the contour lines are then interpolated. CONTOURING 38
INTERPOLATION OF CONTOURS The process of spacing the contours proportionally between the plotted ground – points is termed as interpolation of contours . This becomes necessary in the case of indirect contouring as only the spot levels are taken in this method. While interpolation of contours the ground between any two points is assumed to be uniformly sloping. CONTOURING 39
INTERPOLATION OF CONTOURS • There are three main methods of interpolation: • i) By Estimation:The position of the contour points between ground - points are estimated roughly and the contours are then drawn through these points. This is a rough method and is suitable for small scale maps. • ii)By arithmetical calculation:This is very tedious but accurate method and is used for small areas where accurate results are necessary. The contours are interpolated as under: CONTOURING 40
INTERPOLATION OF CONTOURS ii) By arithmetical calculation: Suppose A and B are two points at a distance of 30 m and the reduced level of A and B are 25.45m and 27.54m respectively .Taking the contour interval as 1m, 26 and 27 m contours may be interpolated in between A and B. The difference of level between A and B is 2.09m.the difference of level between A and 26m,and A and 27m is 0.55mand 1.55 m respectively. Therefore the horizontal distance between A and 26 mcontour =0.55/2.09 x 30m and Between A and 27 m contour =1.55/2.09 x 30m. These distances are then plotted to scale on the map. CONTOURING 41
INTERPOLATION OF CONTOURS (iii) By Graphical method: Graphical method of interpolation is simpler as compared to arithmetical method and also the results obtained are accurate. Out of several graphical methods, the most common is as given below: 65 B 62.5m 2 60 60m 1 55 55m A 51.5m 50 CONTOURING 42
Graphical method: As shown in the fig. suppose the contour interval is 5m, then on a piece of tracing cloth, a number of parallel lines spaced at 0.5m(usually 1/10th of the contour interval) are drawn. Every tenth line being made thick. Suppose it is required to interpolate contours between two points A and B of elevation 51.5m and 62.5m respectively. CONTOURING 43
INTERPOLATION OF CONTOURS (iii) By Graphical method: If the bottom line represents an elevation of 50m. Then the successive thick lines will represent 55m, 60m and 65m, etc. Place the tracing cloth so that the pointAis on the third line from the bottom, now move the tracing cloth untilBis on the fifth line above the 60m thick line. The intersection of the thick lines 1 and 2 representing elevations of55m and 60 m and the lineABgive the position of the points on the 55m and 60m contours respectively and are pricked through on the plan with a pin. CONTOURING 44
DRAWING THE CONTOUR LINES Contour lines are drawn as fine and smooth free hand curved lines. Sometimes they are represented by broken lines .They are inked in either in black or brown colour. A drawing pen gives a better line than a writing pen and French curves should be used as much as possible .Every fifth contour is made thicker than the rest. The elevation of contours must be written in a uniform manner, either on the higher side or in a gap left in the line .When the contour lines are very long, their elevations are written at two or three places along the contour .In the case of small scale maps, it is sufficient to figure every fifth contour. CONTOURING 45
USES OF CONTOUR MAP • A contour map furnishes information regarding the features of the ground , whether it is flat, undulating or mountainous. • From a contour map , sections may be easily drawn in any direction • Intervisibility between two ground points plotted on map can be ascertained • It enables an engineer to approximately select the most economical or suitable site for an engineering project such as a road, a railway, a canal or a pipe line etc. • A route of a given grade can be traced on the map. • Catchment area and capacity of a reservoir may be determined from the contour map. • Contour map may be used to determine the quantities of earth work. CONTOURING 45
HOME ASSIGNMENT Q.No.1.(a) Define contour. (b) What is a contour interval and on what factors does it depend?. Q.No.2.(a) What is difference between a contour interval and horizontal …………….equivalent?. (b) Suggest contour intervals for following :- (i) A hill Survey (ii) A city Survey (iii) survey of a dam site. Q.No.3. Describe with neat sketches the characteristics of contours. Q.No.4. Show contours to represent the following :- (i) A Hill (ii) A Depression (iii) A valley (iv) A vertical cliff (v) A saddle. Q.No.5. Describe various methods of interpolation of contours. CONTOURING 46