Download
1 / 1
10 likes | 171 Views
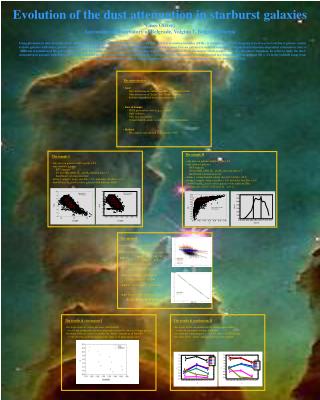
Evolution of the dust attenuation in starburst galaxies Vince Oliver: Astronomical observatory of Belgrade, Volgina 7, Belgrade, Serbia.

E N D
Evolution of the dust attenuation in starburst galaxies Vince Oliver: Astronomical observatory of Belgrade, Volgina 7, Belgrade, Serbia Using photometric data from the SDSS database, the dust attenuation of starburst galaxies with different star formation histories (SFHs) is calculated. The BPT diagram is used to select starburst galaxies and to exclude galaxies with active galactic nuclei (AGNs) from the sample. The r-band isophotal axial ratio is used to select face-on galaxies in order to exclude the complicated inclination-dependent attenuation. Due to different attenuation of the galaxy bulge and disk, the sample is additionally divided according to fracDev, the standard SDSS parameter which roughly describes the galaxy bulginess. In order to study the dust attenuation in galaxies with SFHs, the sample is divided into groups according to Dn4000 and HA spectral indices. The sample is volume limited to r-band absolute magnitude Mr = -21 in the redshift range from 0.01<z<0,2. It is therefore redshift-binned in this volume in order to study the redshift-dependence of the dust attenuation. • The introduction • Goal: • - Dust attenuation in starburst galaxies with different SFHs • - Dust attenuation of “bulgy” and “disky” systems • - Redshift dependence of the dust attenuation • Data & Sample: • - SDSS photometric data (u, g, r, i, and z) • - Only starbursts • - Only face-on galaxies • - Volume limited sample to study the redshift-dependence • Method: • - Flux density ratio method (e.g. Calzetti, 1997) • The sample II • only face-on galaxies with log(a/b) < 0.2 • only starburst galaxies • BPT diagram • SN in [OIII], [NII], H, and Hemission lines > 3 • Kauffmann’s demarcation line • - define a volume limited sample (0<z<0.15 & M < -20.5) • define 2 samples: bulgy (fracDev > 0.5) and disky (fracDev < 0.5) • Dn4000 and HA used to select galaxies with different SFHs • redshift cuts: z<0.07 0.07<z<0.11 z>0.11 • The sample I • only face-on galaxies with log(a/b) < 0.2 • only starburst galaxies • BPT diagram • SN in [OIII], [NII], H, and Hemission lines > 3 • Kauffmann’s demarcation line • -define 2 samples: bulgy (fracDev > 0.5) and disky (fracDev < 0.5) • -Dn4000 and HA used to select galaxies with different SFHs The method Flux ratios method (e.g. Calzetti, 1997): step1: F()/F(z) versus E(B-V)H/H (upper panel) step2: linear fit (upper panel) step3: derive selective attenuation step4: k()-k(z) versus (lower panel) step5: fit power law(lower panel) • The results & conclusions I • the slope of the att. curves decrease with Dn4000 • => old and young stars are more uniformly covered by dust in younger galaxies • the slope of the att. curves is smaller for “bulgy” systems at all Dn4000 • => the presence of bulge shallows the slope at all mean galaxy ages • The results & conclusions II • the slopes of the attenuation curves change with redshift • => the dust geometry evolves with time • -the slope has a maximum at z ~ 0.9 for almost all SFH groups • -the slope of the ”oldest” galaxies decrease with redshift