Download
1 / 11
110 likes | 262 Views
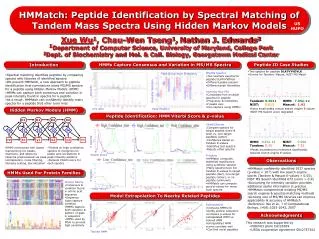
Estimation of Voicing-Character of Speech Spectra Based on Spectral Shap. P. Jancovic and M. Kokuer IEEE Signal Processing Letters, Vol. 14, No. 1, pp. 66-69, Jan. 2007. Presenter Chia -Cheng Chen. Outline. Introduction Voicing-Character Estimation of Speech Spectra

E N D
Estimation of Voicing-Character of Speech Spectra Based on Spectral Shap P. Jancovic and M. Kokuer IEEE Signal Processing Letters, Vol. 14, No. 1, pp. 66-69, Jan. 2007 • Presenter Chia-ChengChen
Outline Introduction Voicing-Character Estimation of Speech Spectra Experimental Results Conclusions
Introduction • Between the shape of the signal short-term magnitude spectra and spectra of the frame-analysis window.
Voicing-Character Estimation of Speech Spectra The short-term Fourier spectrum of a voiced speech segment can be represented as a summation of scaled and shifted.
Voicing-Character Estimation of Speech Spectra(Cont.) • Fourier transform of a frame-window function: • :fundamental frequency Ah :complex amplitude,
Voicing-Character Estimation of Speech Spectra(Cont.) Voicing-distance: Voicing-Distance Calculation for Filter-Bank Channels:
Experimental Results Hamming window with various values of M
Experimental Results(Cont.) comparison with rectangular and Blackman–Harris windows (for best M)
Conclusions Based on calculating a distance between the shape of the signal short-term spectra and spectra of the frame-analysis window.