Download
1 / 48
490 likes | 744 Views
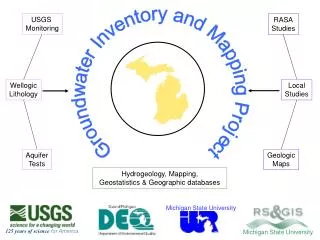
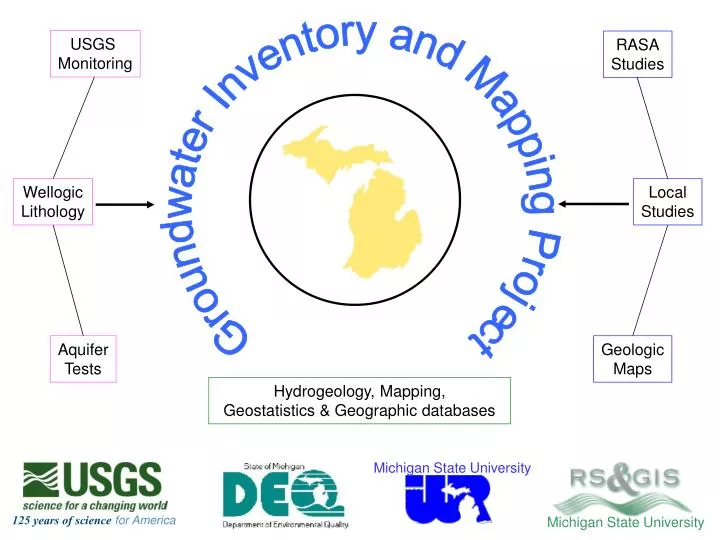
Michigan State University. 125 years of science for America. Michigan State University. USGS Monitoring. RASA Studies. Groundwater Inventory and Mapping Project. Wellogic Lithology. Local Studies. Aquifer Tests. Geologic Maps. Hydrogeology, Mapping,

E N D
Michigan State University 125 years of sciencefor America Michigan State University USGS Monitoring RASA Studies Groundwater Inventory and Mapping Project Wellogic Lithology Local Studies Aquifer Tests Geologic Maps Hydrogeology, Mapping, Geostatistics & Geographic databases Groundwater Inventory and Mapping Project
In August 2003, the Michigan Legislature passed Public Acts 148 and 177. PA 148 requires that a groundwater inventory and map be generated for the State by August 2005. PA 177 set up a procedure to address groundwater-withdrawal conflicts in the State. Overview Groundwater Inventory and Mapping Project
“... the department shall collect and compile groundwater data into a statewide groundwater inventory and map.”Sec. 32802 (1) “The department shall make the statewide groundwater inventory and map available to the general public.”Sec. 32802 (2) The project team MDEQ U.S. Geological Survey Michigan State University PA 148 Groundwater Inventory and Mapping Project
Dr. Howard W. ReevesUSGS Research Hydrologist Dr. David P. LuschSenior Research Specialist MSU - RS&GIS Research & Outreach Services, Geography - Institute of Water Research Steve A. Miller, PESpecialist MSU - BioSystems and Agricultural Engineering Brant Fisher, PE and Joseph LovatoMDEQ Water Bureau, Groundwater Section Project Leaders Groundwater Inventory and Mapping Project
PA 148, Sec. 32802 (1) Location and water yielding capabilities of aquifers in the state. Aquifer recharge rates in the state, if available to the department. Static water levels of groundwater in the state Base flow of rivers and streams in the state. Conflict areas in the state. Surface waters, including designated trout lakes and streams, and groundwater dependent natural resources, that are identified on the natural features inventory. The location and pumping capacity of all of the following: (i) Industrial or processing facilities registered under section 32705 that withdraw groundwater. (ii) Irrigation facilities registered under section 32705 that withdraw groundwater. (iii) Public water supply systems that have the capacity to withdraw over 100,000 gallons of groundwater per day average in any consecutive 30-day period. Aggregate agricultural water use and consumptive use, by township. The department shall include data on all of the following in the statewide groundwater inventory and map: Groundwater Inventory and Mapping Project
How to define aquifers Statewide – especially for glacial deposits. • How to combine information from a variety of sources at different spatial scales. • How to express uncertainty. • How to express water yielding capability • Typical observed yield • Maximum potential yield • Yield based on drawdown constraints • Ecological or water-balance constraints Data and analysis needs increase Scientific Challenges Groundwater Inventory and Mapping Project
Identify and compile major data sources for each required element. Assemble inventory for incorporation into a database accessible through an internet and an ArcIMS web site for map presentation. Subdivide aquifer analysis to identify bedrock aquifers and water yield from glacial deposits. Treat glacial deposits as single aquifer unit with varying properties. Approach Groundwater Inventory and Mapping Project
Straightforward mapping issues. Base flow and recharge issues. Static-water-level mapping. Aquifer and water-yield mapping. Presentation of results to the public. Presentation Sequence Groundwater Inventory and Mapping Project
Conflict areas in the state. Surface waters, including designated trout lakes and streams, and groundwater dependent natural resources, that are identified on the natural features inventory. The location and pumping capacity of all of the following: (i) Industrial or processing facilities registered under section 32705 that withdraw groundwater. (ii) Irrigation facilities registered under section 32705 that withdraw groundwater. (iii) Public water supply systems that have the capacity to withdraw over 100,000 gallons of groundwater per day average in any consecutive 30-day period. Aggregate agricultural water use and consumptive use, by township. Straightforward Mapping Issues Groundwater Inventory and Mapping Project
Data Sources Conflicts reported to MDEQ through PA 177. Limitations Groundwater “conflicts” can occur for variety of reasons. For example, the “conflict” regarding the Nestle Ice Mountain bottling in Mecosta County is not due to the impact of the withdrawal on nearby wells as defined in PA 177. This type of “conflict” will not be mapped. (e) Conflict areas in the state Groundwater Inventory and Mapping Project
(e) Conflict areas in the state PA 177 (Public Acts of 2003) was in effect for well owners in Fremont, Richland, Lakefield, and Jonesfield townships of Saginaw County and throughout Monroe County through June 30, 2004. PA 177 became effective statewide on July 1, 2004. Groundwater Inventory and Mapping Project
(e) Conflict areas in the state • PA 177 Groundwater Dispute Complaints Filed (10/1/03 - 1/11/05) County Nature No. of Complaints VERIFIED COMPLAINTS Agricultural Irrigation Saginaw 8 Limestone Quarry Dewatering Monroe 14 UNVERIFIED / DISMISSED COMPLAINTS 1 Agricultural Irrigation Gratiot Macomb 1 Construction Dewatering 3 Charlevoix Cement Plant 1 Kent Golf Course 1 Genesee Aggregate Pit Construction Dewatering 1 Total 30 Groundwater Inventory and Mapping Project
Data Sources Natural Features Inventory (MNFI) MDNR Limitations Other ecological settings and other fisheries depend on groundwater and these will not be noted on this map. The site-specific role of groundwater in most ecological settings is unknown. (f) ...designated trout lakes and streams, and groundwater dependent natural resources... Groundwater Inventory and Mapping Project
(f) ...designated trout lakes and streams, and groundwater dependent natural resources... Under the authority of sections 41103, 48701, and 48716 of Act 451 of the Public Acts of 1994, as amended, the Director of the Department of Natural Resources established these stream and lake classifications on October 10, 2003 to be in effect for five years. Groundwater Inventory and Mapping Project
Data Sources MDEQ Water Use Reporting Program Limitations Industries, non-farm irrigators and public water supplies report use, not capacity. Some of these facilities have many wells spread over a large area (e.g. Lansing has 127 wells). The contribution to the total from each well is not provided. This lack of specific pumping information for individual wells limits the usefulness of this information to regional assessment rather than site-specific studies. (g) The location and pumping capacity of all of the following… Groundwater Inventory and Mapping Project
Data Sources MDA for irrigation use reported under PA 148 Sec. 32708 MDEQ for irrigation use reported under PA 148 Sec. 32707 MDEQ Water Use Program in conjunction with MSU extension and MSU irrigation estimation procedures Limitations The township aggregation limits the usefulness of these data to regional assessment rather than site-specific studies. Consumptive use is difficult to assess without site-specific studies on individual farms. Use vs. capacity (h) Aggregate agricultural water use and consumptive use, by township. Groundwater Inventory and Mapping Project
Data Sources Estimate published by U.S. Geological Survey (1996) National base flow index published by U.S. Geological Survey (2003) Updated estimate being made for Great Lakes Basin by U.S. Geological Survey and Environment Canada MDNR Fisheries Division estimate Limitations Statistical correlations are required to estimate base flow for the ungaged basins. Regulation by dams, water discharge by waste water treatment plants, and other factors impact stream-flow records, making base-flow estimates difficult to compute. (d) Base flow of rivers and streams in the state Groundwater Inventory and Mapping Project
Base flow Index at individual stream gages (Base Flow Index = ratio of base flow to total annual flow) Estimated base flow index by watershed Groundwater Inventory and Mapping Project
Data Sources Typically, recharge is estimated from base flow: long-term base flow is recharge to groundwater basin. 1996 USGS Estimate Updated estimate will be derived from base flow determined in USGS & Environment Canada project. USGS Regional Aquifer System Analysis (RASA) study for bedrock aquifers. Limitations Estimate is based on base flow from streams, which gives recharge primarily to glacial deposits not bedrock aquifers. RASA modeling study only for Lower Peninsula, predevelopment conditions (no pumping), and small-scale. (b) Aquifer recharge rates in the state, if available to the department. Groundwater Inventory and Mapping Project
Data Sources Hydrography from Center for Geographic Information (MDIT) Soils maps (USDA, NRCS) Wetlands (National Wetlands Inventory) Water levels reported in Wellogic database USGS RASA study (bedrock aquifers) Limitations Water levels are not temporally static – in addition to the map, we will provide hydrographs showing the temporal variation in groundwater levels. Detailed soils maps do not exist for all counties. Bedrock coverage is poor outside of the central Lower Peninsula. (c) Static water levels of groundwater in the state Groundwater Inventory and Mapping Project
Shows period of record and summary plot for 5-day moving average shown as water year. average – 1 sd 5-day moving average Summary plot showing current condition relative to the historic trend. average + 1 sd Water levels are not temporally static! Groundwater Inventory and Mapping Project
Information from various sources is combined to estimate the water-level elevation in the shallow glacial deposits. Originally estimated for the Source Water Assessment Project to allow MDEQ and local health departments to assess the vulnerability of groundwater to surface spills or other potential contaminant sources. Updated with new soils and Wellogic data in this project. Over much of the state, this is a reasonable estimate of the water table. In some areas, the mapped water level is for a perched system that is separated from a more extensive regional glacial aquifer. The term “First Water Surface” is used to denote the elevation of the water table or perched system. First Water Surface Groundwater Inventory and Mapping Project
First Water Surface Groundwater Inventory and Mapping Project
Data Sources Wellogic water well record database (MDEQ) MDEQ public water supply aquifer-test database Aquifer-test database compiled from MDNR records by USGS as part of RASA study Aquifer properties reported in the literature U.S. Geological Survey reports MDNR reports Other published sources Location and water yielding capabilities of aquifers in the state Groundwater Inventory and Mapping Project
Limitations We lack a large-scale, 3-D geologic framework to derive the hydrogeology of the glacial deposits that cover most of the state (Glacial Landsystems map provides a small-scale 1:500K, 2-D framework). Water well records in the Wellogic database have varying degrees of detail and quality, but do provide our best third-dimension view of the drift. Public water supply aquifer tests tend to be available for wells that have sufficient yield for a municipal supply. Hence, this dataset is biased against wells with low - moderate yields (i.e. typical residential wells). Location and water yielding capabilities of aquifers in the state Groundwater Inventory and Mapping Project
A geologic framework for glacial hydrogeology. This map depicts the major glacial depositional environments of Michigan. Groundwater Inventory and Mapping Project
Location and water yielding capabilities of aquifers in the state Groundwater Inventory and Mapping Project
Bedrock Wells 27% (75,395) of the qualified Wellogic records 282,802 qualified Wellogic records (i.e. contain geolocation & good lithology data) Groundwater Inventory and Mapping Project
Location and water yielding capabilities of aquifers in the state The broad patterns of the glacial aquifers have been agreed to for many years Groundwater Inventory and Mapping Project
73% (207,407) of the qualified Wellogic records 282,802 qualified Wellogic records (i.e. contain geolocation & good lithology data) Glacial Wells Groundwater Inventory and Mapping Project
Required Aquifer properties Transmissivity Storativity Yield Mapping Groundwater Inventory and Mapping Project
>100,000 mg / l >1,000 to <100,000 mg / l Marshall Aquifer Saginaw-Parma Aquifer Bedrock Aquifer Transmissivity Groundwater Inventory and Mapping Project
Transmissivity of the Drift Package Groundwater Inventory and Mapping Project
Public Availability • “The department shall make the statewide groundwater inventory and map available to the general public.” P.A. 148, Sec. 32802 (2) • The team will meet this mandate using Internet delivery technology. Groundwater Inventory and Mapping Project
Public Availability • http://gwmap.rsgis.msu.edu Introductory material Interactive map Links to background material Groundwater Inventory and Mapping Project
Link to USGS Observation Well Network Groundwater Inventory and Mapping Project
Observation well influenced by irrigation wells Groundwater Inventory and Mapping Project
Zoom in on water well in Kalamazoo County Groundwater Inventory and Mapping Project
When map scale is appropriate, the location of wells with records in the Wellogic database may be shown. Groundwater Inventory and Mapping Project
Selecting a well on the map queries the Wellogic database via the www Groundwater Inventory and Mapping Project
Public Availability • http://gwmap.rsgis.msu.edu Access to the “value-added” WELLOGIC data Groundwater Inventory and Mapping Project
Public Availability • http://gwmap.rsgis.msu.edu Groundwater Inventory and Mapping Project
From WELLOGIC well record pdf Lithology information in the Wellogic database is also available Note the value-added fields Groundwater Inventory and Mapping Project
All the maps developed by the project (with metadata) will be available on-line at the project web site. Our inventory of groundwater data will also be available on-line in a searchable database. Hard-to-find reports will be scanned and made available (as .pdf files) through the project web site. Data about aquifer properties will be available with references back to the original source. New Web Resources Groundwater Inventory and Mapping Project
New Web Resources Example: Search for data from Baraga County Baraga Groundwater Inventory and Mapping Project
New Web Resources Groundwater Inventory and Mapping Project