Download
1 / 39
390 likes | 566 Views
D-optimal Adaptive Bridging Studies in Pharmacokinetics. Lee-Kien Foo Stephen Duffull. Modelling and Simulation Lab, School of Pharmacy, University of Otago, New Zealand. Bridging Studies. A concept for extrapolating information gathered from a clinical study in

E N D
D-optimal Adaptive Bridging Studies in Pharmacokinetics Lee-Kien Foo Stephen Duffull Modelling and Simulation Lab, School of Pharmacy, University of Otago, New Zealand
Bridging Studies • A concept for extrapolating information gathered from a clinical study in an original region to a new region • One of the purposes is to assess the dose exposure relationship in the new region
Optimal Adaptive Design Initial design Collect data Refine design Fit a model Optimize design
Aim To develop an optimal adaptive design method for bridging studies (D-optimal ABS) that can be applied to pharmacokinetics
This Talk • D-optimal ABS • Simulation studies • Results • Discussion
D-optimal ABS • Information from a prior population • Adaptive D-optimal design • Combine information in the process • Learn about the target population
D-optimal ABS Collect data from prior population Initial design Fit the model D-optimal design
D-optimal ABS Collect data from prior population Initial design Fit the model Collect batch data from target population D-optimal design
D-optimal ABS Collect data from prior population Initial design Reduce data proportionally Pool data Fit the model Collect batch data from target population D-optimal design
D-optimal ABS Collect data from prior population Initial design Reduce data proportionally Pool data Fit the model Collect batch data from target population D-optimal design
D-optimal ABS • Iteration b • Estimation: • Population Fisher information matrix:
Simulation Studies • Simulation studies were performed for two different scenarios • Carried out in MATLAB and NONMEM, called from MATLAB, is used for estimation • POPT is used to find the D-optimal design • 100 D-optimal ABS were simulated for each scenario • The relative percentage difference of the estimated parameter values from the true parameter values (%RE) were used to assess the performance of the 100 D-optimal ABS
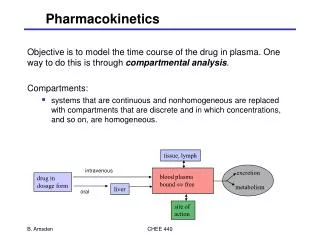
Simulation Study 1: Context • Bridging study from adult patients to paediatric patients • Dose schedule is based on mg/kg • Paediatric patients parameter values were scaled allometrically • Drug is a small molecule and given orally • Bateman pharmacokinetic model
Simulation Study 1 • Bateman pharmacokinetic model
Simulation Study 1 • Bateman pharmacokinetic model Linear accumulation:
Simulation Study 2: Context • Bridging study from normal weight adult patients to obese adult patients • Drug is a large molecule and given subcutaneously • Delayed absorption in obese patients • Transit compartment model
Simulation Study 2 • Transit compartment model
Simulation Study 2 • Transit compartment model
Simulation Study 2 • Linear accumulation • Geometric accumulation • Number of batches:
Simulation Study 2Geometric Accumulation with Mixture Model Estimation - %RE(Omega)
Discussion • Both linear and geometric accumulation D-optimal ABS provides reasonable parameter estimates in the last iteration • D-optimal ABS is a potentially useful method for bridging studies • Need to test on batch size
Acknowledgements • Professor Stephen Duffull • School of Pharmacy • University of Otago • PAGE • Pharsight student sponsorship • Modelling and Simulation lab members
Simulation Study 2 Linear Accumulation with Mixture Model Estimation
Simulation Study 2 Linear Accumulation with Mixture Model Estimation
Simulation Study 2 Geometric Accumulation with Mixture Model Estimation
Simulation Study 2 Geometric Accumulation with Mixture Model Estimation