Download
1 / 15
150 likes | 565 Views
The t distribution and the independent sample t-test. i271B. Some Data Considerations for Final Exam:. Two metric variables Correlation One binary categorical variable, one metric variable T-test Two categorical variables Chi-Square ( crosstabulations )

E N D
Some Data Considerations for Final Exam: • Two metric variables • Correlation • One binary categorical variable, one metric variable • T-test • Two categorical variables • Chi-Square (crosstabulations) • Polytomous dependent variable, metric IV • ANOVA • Metric dependent variable, multiple IV’s • Linear Regression
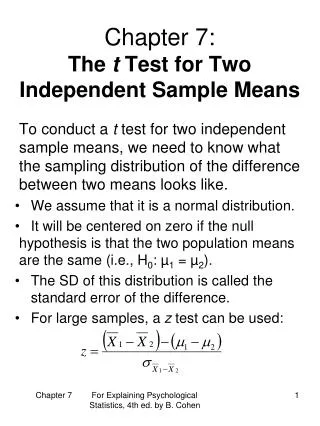
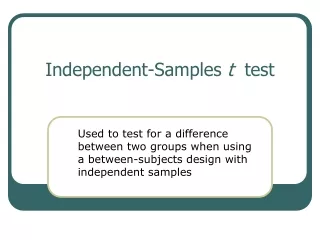
How do we test to see if the means between two sample populations are, in fact, different?
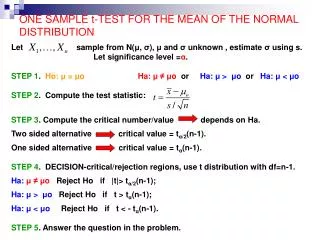
Null and Alternative Hypotheses • Null Hypothesis: • H0: μ1 = μc • Alternative Hypotheses: • H1: μ1 < μc • H2: μ1 > μc • H3: μ1 ≠ μc
Why use the t distribution? • Useful for testing mean differences when the N is not very large • In very large samples, a t-test is the same as a z-score test. Why?
The t-test • Where: M = mean SDM = Standard error of the difference between means N = number of subjects in group s = Standard Deviation of group df = degrees of freedom Essentially, the t-value is the difference between group means (mean difference), divided by the variability of the two groups (standard error of difference).
Standard Deviations vs. Standard Errors • Standard deviation is a measure of spread for a given measure. • Standard error of a given statistic is the standard deviation of the sampling distribution of that statistic. Standard Error of the mean
Degrees of freedom • d.f. = the number of independent pieces of information from the data collected in a study. • Example: Choosing 10 numbers that add up to 100. • This kind of restriction is the same idea: we had 10 choices but the restriction reduced our independent selections to N-1. • In statistics, further restrictions reduce the degrees of freedom. • In the t-test, since we deal with two means, our degrees of freedom are reduced by two (df = n1 + n2 – 2)
t distribution • As the degrees of freedom increase (towards infinity), the t distribution approaches the z distribution (i.e., a normal distribution) • Because N plays such a prominent role in the calculation of the t-statistic, note that for very large N’s, the sample standard deviation (s) begins to closely approximate the population standard deviation (σ) • http://www.econtools.com/jevons/java/Graphics2D/tDist.html
Assumptions Underlying the Independent Sample t-test • Assumption of Normality • Variables are normally distributed within each group • Assumption of Homogeneity of Variance • Variation of scores in the two groups should not be very different.
What if the Variances are not equal? • We can test to see if the variances are significantly different between groups (equality of variance test) • If they *are* significantly different, we can use a modified t-test that corrects for this problem (Welch’s t-test) • Essentially, the Welch’s t-test uses a different estimation of the degrees of freedom and also avoids using the pooled variance.
Calculating Effect Size • Note that the SD in the effect size calculation is the pooled (combined) standard deviation for both groups • Effect size allows you to compare relative effect of one test to another (using same dependent variable) • Conceptually, think of effect size as increasing the probability that you could guess which group a given person came from. • Values of .8 or greater are usually large effects, .5 medium, .2 small. • Effect size is a measure of practical significance, not statistical significance.
t-tests using STATA • t-test.do • auto.dta dataset • grades.dta dataset