Download
1 / 55
550 likes | 649 Views
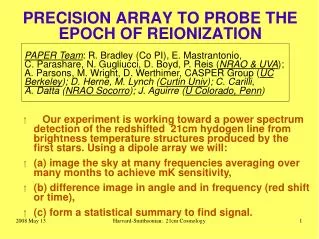
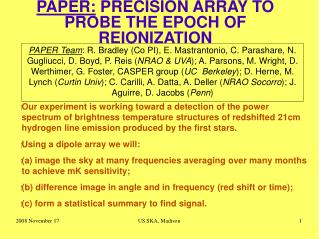
Precision Array to Probe the Epoch of Reionization Chris Carilli JPL, May 2013. I. Introduction: Cosmic Reionization Concept Constraints on evolution of neutral IGM II. HI 21cm line Potential for direct detection of the neutral IGM PAPER design and first results.

E N D
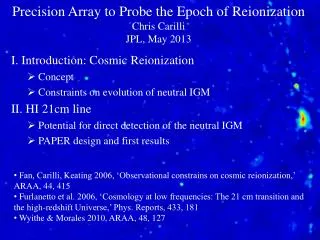
Precision Array to Probe the Epoch of Reionization Chris Carilli JPL, May 2013 • I. Introduction: Cosmic Reionization • Concept • Constraints on evolution of neutral IGM • II. HI 21cm line • Potential for direct detection of the neutral IGM • PAPER design and first results • Fan, Carilli, Keating 2006, ‘Observational constrains on cosmic reionization,’ ARAA, 44, 415 • Furlanetto et al. 2006, ‘Cosmology at low frequencies: The 21 cm transition and the high-redshift Universe,’ Phys. Reports, 433, 181 • Wyithe & Morales 2010, ARAA, 48, 127
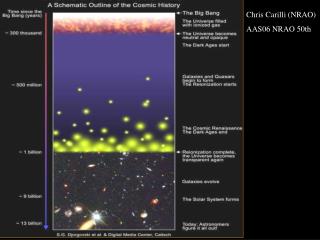
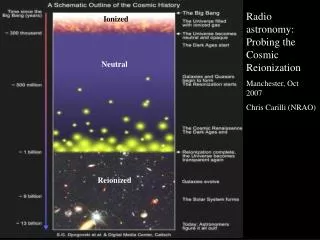
History of the IGM (Hydrogen) Big Bang f(HI) ~ 0 Recombination 0.4 Myr z = 1000 f(HI) ~ 1 Reionization 0.3 - 0.8 Gyr z ~ 7 to 15 f(HI) ~ 10-5 13.6Gyr z = 0
Cosmic microwave background radiation Recombination Early structure formation PLANCK – imprint of primordial structure from the Big Bang
Big glass: HST, VLT, VLA Late structure formation Realm of the Galaxies
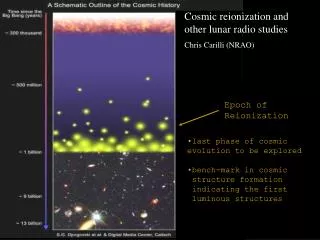
Universumincognitus Dark ages • Last phase of cosmic evolution to be tested and explored • Cosmological benchmark: formation of first galaxies and quasars • Today’s focus: Evolution of the neutral IGM and reionization • When? • How fast? • HI 21cm signal Cosmic Reionization
Numerical Simulations of the evolution of the IGM (Gnedin & Fan 2006, 648, 1) F(HI) from z=20 to 5 • Three phases • Dark Ages • Isolated bubbles (slow) • Percolation (bubble overlap, fast) 10cMpc • Matches UV lum. func. at z=5 to 8 • Consistent with GP constraints on the IGM opacity at z ~ 6
Constraint I: Large scale polarization of the CMB (WMAP) • Thomson scattering CMB (local quadrupole) during reionization • Integral measure of e back to recombination => broad range models • Rules-out high ionization fraction at z > 15 • Allows for small (≤ 0.2) ionization to high z • Most ‘action’ at z ~ 8 – 13 e = 0.087 +/- 0.015 Two-step reionization: 7 + zr Dunkley ea 2009, ApJ 180, 306
Constraint II: Quasar spectra Neutral IGM after reionization = Lya forest • Lya resonant scattering by neutral gas in IGM clouds • Linear density inhomogeneities, δ~ 10 • N(HI) = 1013 – 1015 cm-2 • F(HI) ~ 10-5 z=0 z=3
Gunn-Peterson effect 6.4 SDSS z~6 quasars Opaque (τ > 5) at z>6 => pushing into reionization? 5.7 SDSS quasars Fan et al 2006
Gunn-Peterson constraints on F(HI) τeff Becker et al. 2011 • Diffuse IGM: • GP = 2.6e4 F(HI) (1+z)3/2 • Clumping: GP dominated by higher density regions =>need models of ρ, T, UVBG to derive F(HI) • Challenge: Saturates at low F(HI) • F(HI)v~ 10-5 at z < 4 • F(HI)v≥ 10-4 at z ~ 6
CMBpol F(HI)v Lya Forest/GP • GP => systematic rise of F(HI) to z ~ 6.5 • CMBpol => mostly neutral at z>15, mostly ionized at z < 8
Quasar Near Zones: J1148+5251 • Host galaxy redshift: z=6.419 • Quasar spectrum => photons leaking down to z=6.32 White et al. 2003 • Time bounded Stromgren sphere ionized by quasar • Difference in zhost and zGP => • RNZ =4.7Mpc ~ [Lγ tQ/FHI]1/3 (1+z)-1 • cf. ‘proximity zone’ interpretation, Bolton & Haehnelt 2007 HII HI
QNZ: analyze size evolution of 28 quasars at z=5.7 to 6.5 with measured zhost and zGP I. zhost: from CO, [CII], MgII, CIV… II. zGP: structure => depends on resolution. 1st point when transmission drops below 10% (well above GP level) at 20A res => uniform, but relative, measure of size of QNZ, δz~ 0.01 z = 6.1 Wyithe et al. 2010
Quasar Near-Zones: 28 GP quasars at z=5.7 to 6.5 LUV R Lγ1/3 LUV • No correlation of UV luminosity with redshift • Correlation of RNZ with UV luminosity • Note: significant intrinsic scatter due to local environ., tq
Quasar Near-Zones: RNZvsredshift [normalized to M1450 = -27] RNZ = 7.3 – 6.5(z-6) z>6.15 • <RNZ> decreases by factor 2.3 from z=5.7 to 6.5 • If CSS=> F(HI)increases by factor ~ 10 (10-4 to 10-3)
CMBpol QNZ GP • QNZ => fairly rapid rise in F(HI) at z ~ 6? • Challenges: relative measure of size, pre-ionization, internal clumping
Highest redshift quasar, z=7.1: revolutionary result? Clear GP absorption trough: τ > 5 => IGM opaque to Lya at z ≥ 6 Mortlock ea. Nat 474,616 Bolton ea. MNRAS, 466, L270 6.2, 6.4, 7.1 7.0 6.0 5.2
z=7.1 quasar near zone small ~ 2Mpc z ≤ 6.4 z=7.1 Continues trend for decreasing NZ size with z
z=7.1 quasar: Damped Lya profile • N(HI) > 1020.5 cm-2 • Substantially neutral IGM: f(HI) > 0.1 at 2Mpc distance, or • Damped Lya galaxy at 2.6Mpc (probability ~ 5%) 0.5 f(HI)=0.1 1.0 N(HI)=4e20 cm-2 at 2.6Mpc Bolton ea., Mortlock ea
3.34 0.95 0.48 0.65 0.38Gyr CMBpol Q-DLA Gnedin & Fan model QNZ GP • z=7.1 quasar => rapid change in IGM (‘cosmic phase transition’)? • Challenge: only one example
3.34 0.95 0.48 0.65 0.38Gyr CMBpol integral measure τe Q-DLA one source Gnedin & Fan model relative measure QNZ saturates GP • Amazing progress, suggesting rapid change in IGM at z~7 • All values have systematic/modeling uncertainties • => Need new means to probe reionization
HI 21cm line: Most direct probe of the neutral IGM • Low frequencies: • νobs = 1420MHz/(1+z) ≤ 200 MHz • Advantages of the 21cm line • Direct probe of neutral IGM • Spectral line signal => full three dimensional image of structure formation (freq = z = depth) • Low freq => very (very) large volume surveys (1sr, z=7 to 11) • Hyperfine transition = weak => avoid saturation (translucent)
‘Richest of cosmological data sets’ z>200: TCMB = TK= TSby residual e-, photon, and gas collisions. No signal. z∼30 to 200: gas cools as Tk ≈ (1+z)2 vs. TCMB≈ (1 + z), but TS = TK via collisions => absorption, until density drops and Ts TCMB z∼20 to 30: first stars => Lyα photons couples TK and TS=> 21-cm absorption z∼6 to 20: IGM warmed by hard X rays => TK > TCMB. TS coupled to TK by Lya. Reionization is proceeding => bubble dominated IGM reionized TK TS Tcmb D A E C B First stars Pritchard & Loeb
MWA - Oz PAPER - SA Pathfinders: 1% to 10% of a square kilometer array
Precision Array to Probe Epoch of Reionization Don C. Backer Array Berkeley, NRAO, Penn, SKA/South Africa • Focus: low-ν array to study HI 21cm signal from reionization • Precision: emphasize engineering solutions first • Staged: work through problems before increasing investment
Signal end-game: HI 21cm ‘tomography’ of IGM 9 z= 12 ν21= 109 MHz • Imaging of typical structures requires full Square Kilometer Array • TB(2’) ~ 20 mK ~ 8uJy • SKA rms ~ 4mK z=7.6 ν21= 165 MHz 10cMpc = 4’ Furlanetto ea 2004
Near-term Reionization: Pathfinder science goals 3D power spectrum in 21cm line characteristic bubble scale z==12, f(HI) = 0.9 z=7, f(HI) = 0.02 Barkana 2009
32 station engineering array in Greenbank, WV • PAPER basics • Freq = 115 to 190 MHz (z= 6.5 to 11) • Single dipole elements + ‘flaps’ => FoVFWHM ~ 40o • Max baseline = 300m => res ~ 15’ Build-out to 128 antennae science array in Karoo, South Africa in 2013 (currently 64)
Reconfigurable => optimize for science goal Minimum redundancy array maximize u,v coverage => imaging Maximum redundancy: delay spectrum analysis
Established working array from scratch in ~ 6months, with help from ZA (SKA, Durban) Durban University of Technology PAPER 575 km Cape Town
Challenge: Interference: ZA RQZ PAPER South Africa TV OrbComm FM ISS OrbComm 200MHz 100MHz 100MHz 200MHz US ‘radio quiet zone’ ZA ‘radio quiet zone’
Challenge: hot, confused sky at low freq Haslam, Eberg 408MHz • Coldest regions: T ~ 100 (/200 MHz)-2.6 K = 104x 21cm signal • Highly ‘confused’: 1 source/deg2 with S140 > 1 Jy
Solution: spectral decomposition • Foreground= non-thermal= featureless over ~ 100’s MHz • Signal = fine scale structure on scales ~ MHz Signal/Sky ~ 10-5 Cygnus A z=7 z=13 500MHz 5000MHz Critical to mitigate freq dependent telescope response!
Gain • PAPER Antenna: ‘clean machine’ • Sleeve dipole + flaps • Smooth, broad response in frequency and angle 10dB 120MHz 200MHz LNA: Trx = 110K, 30dB gain 120-180MHz
PAPER Primary beam FW10% ~ 90o Measure power pattern using Orbcom at 136MHz
PAPER: (Xilinx) FPGA+ GPU correlator from Berkeley wireless lab (CASPER) • ROACH2 F engine: sample/digitize, transform (τν), using polyphase filter (‘preconvolution’) • GPU X engine: cross multiply V (B, ν) • Cross-connections: ‘packetizedcorrelator’ using 10Gb Ethernet protocol + commercial data routers • Computing, processing, storage (Penn) • Cluster computing: 32 octal core servers • Store raw visibilities: RAIDS 120 TB • AIPY (Berkeley), CASA, AIPS (NRAO)
Power spectrum approach: ‘delay spectrum’ (Parsons ea) • Redundant spacings: identical measurements => add spectra coherently => ‘signal to noise’ of PS measurement improves linearly with number of measurements, N, vs. as N1/2 with incoherent averaging (add and square vs. square and add) • Delay spectrum: PS strictly in frequency domain • Work ‘outside wedge’: reduce continuum contribution • Parsons et al. 2013, ApJ, submitted (arXiv:1304.4991) • Pober et al. 2013, ApJ, 768, L36 • Moore et al. 2013, ApJ, 769, 154 • Parsons et al. 2012, ApJ, 756, 165 • Parsons et al. 2012, ApJ, 753, 81
‘delay spectrum’ • Freq maps to distance => Fourier conjugate (delay) maps to wavenumber • Analyze PS per Nred baselines, time in kpar: PS = square of Ft(VK(ν)) = V2K(τ) • Advantages: • Allows study of smaller k scales • Mitigates continuum dynamic range problems
‘The Wedge’ • Max. geometric delay for celestial sources • Consider kperp (angle) vs. kpar(freq) => smooth spectrum sources naturally limited in delay (kpar) space to delays < geom. max. • Line sources extend beyond wedge in DS Delay or Freq-1 ‘horizon limit’ for continuum sources Baseline or Angle-1
PAPER 32 Power spectrum • 300hrs, 32ant, 70 redundant baselines of 30m length • k ~ 0.1 to 0.2 h-1 Mpc-1: • k3/2π2 P(k) < 2600 mK2 • 5 order of magnitude continuum suppression • Best limits to date by 100x • Still inconsistent with thermal noise => residual (pol.) continuum? • Still 100x above predictions of fiducialreionizaiton models (eg. McQuinnea) ‘horizon limit’ = ‘wedge’ Pacigaea GMRT Tsys=560K Fiducial
Ruling out pathological (but not impossible?) models • Model: neutral IGM remains cold (no large-scale Xray warming), but enough Lya to couple Tsand TK and reionization proceeds locally => <TB> ~ 400mK • Build-out 2013 to 2015 • 128 elements • 2 years observing • Full polarization (get to thermal noise) • ~10x improvement (in mK) => constrain fiducial models ‘horizon limit’ = ‘wedge’ No warming Fiducial
‘Richest of cosmological data sets’ z>200: TCMB = TK= TSby residual e-, photon, and gas collisions. No signal. z∼30 to 200: gas cools as Tk ≈ (1+z)2 vs. TCMB≈ (1 + z), but TS = TK via collisions => absorption, until density drops and Ts TCMB z∼20 to 30: first stars => Lyα photons couples TK and TS=> 21-cm absorption z∼6 to 20: IGM warmed by hard X rays => TK > TCMB. TS coupled to TK by Lya. Reionization is proceeding => bubble dominated IGM reionized TK TS Tcmb No warming D A E C B
Anscillary science: Unique parameter space • Continuous ‘all-sky’ monitor (GRBs, XRBs...) • Sensitive to LSS (15deg at 15’ res) • Sensitivity(10min) ~ 5mJy • Broad freqrange • Violates all assumptions in synthesis imaging (eg. SIRA) • Transit array => image in snapshots in time (10min) • Very wide field (‘full sky’) => require 3D FT (facets) • Very wide band (octave) => require multifreq synthesis (currently image snapshots in freq ~ 10MHz) • Very high dynamic range > 105: requires extensive iteration in selfcal/deconvolution • Structure on all scales => require ‘multiscale clean’ • Strong and weak RFI: multiple layers of flagging
10min snapshots DNR ~1000 All sky, All the time 10o
Centaurus A: physics of radio galaxies (Stefan ea. 2013) 150MHz + RASS 1.4GHz 8o ~ 600kpc • Xray correlations • Knots in South = IC? B ~ 1 uG ~ BMP • Lobe pressure ~ IGM ~ 10-13 dyn cm-2 • Spectral flattening in regions of ‘heavy weather’: Vortices shells, rings, waves (Feainea) => local particle acceleration