Download
1 / 38
400 likes | 650 Views
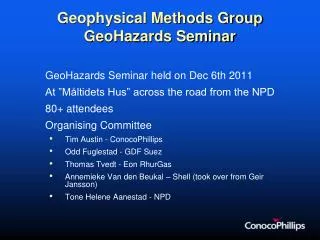
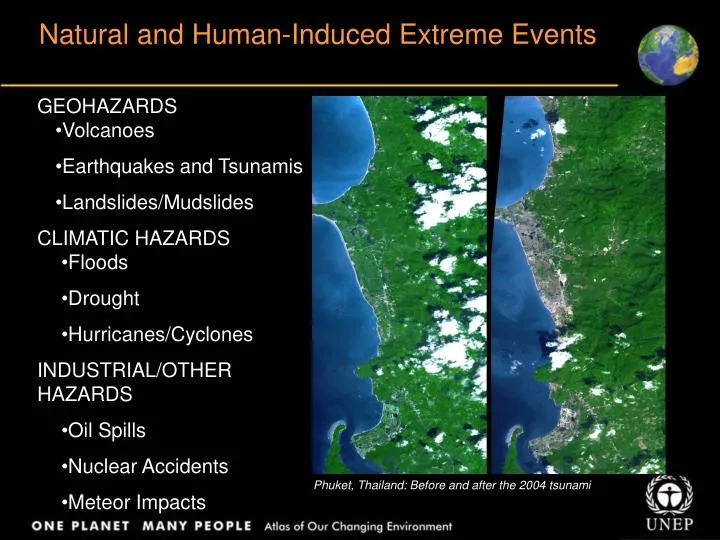
Natural and Human-Induced Extreme Events. GEOHAZARDS. Volcanoes Earthquakes and Tsunamis Landslides/Mudslides. CLIMATIC HAZARDS. Floods Drought Hurricanes/Cyclones. INDUSTRIAL/OTHER HAZARDS. Oil Spills Nuclear Accidents Meteor Impacts.

E N D
Natural and Human-Induced Extreme Events GEOHAZARDS • Volcanoes • Earthquakes and Tsunamis • Landslides/Mudslides CLIMATIC HAZARDS • Floods • Drought • Hurricanes/Cyclones INDUSTRIAL/OTHER HAZARDS • Oil Spills • Nuclear Accidents • Meteor Impacts Phuket, Thailand: Before and after the 2004 tsunami
Hazards & Vulnerabilty Research Institute (2006). 2005 U.S. Hazard Losses. University of South Carolina. UN International Strategy for Disaster Reduction (2006). 2005 Disasters in Numbers
Sapir et al., (2004). Thirty Years of Natural Disasters 1974-2003: The Numbers. Centre for Research on the Epidemiology of Disasters.
Sapir et al., (2004). Thirty Years of Natural Disasters 1974-2003: The Numbers. Centre for Research on the Epidemiology of Disasters.
UN International Strategy for Disaster Reduction (2006). 2005 Disasters in Numbers
UN International Strategy for Disaster Reduction (2006). 2005 Disasters in Numbers Abramovitz, JN (2001). Unnatural Disasters. Worldwatch Institute.
Sapir et al., (2004). Thirty Years of Natural Disasters 1974-2003: The Numbers. Centre for Research on the Epidemiology of Disasters.
Abramovitz, JN (2001). Unnatural Disasters. Worldwatch Institute. Sapir et al., (2004). Thirty Years of Natural Disasters 1974-2003: The Numbers. Centre for Research on the Epidemiology of Disasters.
UN International Strategy for Disaster Reduction (2006). 2005 Disasters in Numbers
UN International Strategy for Disaster Reduction (2006). 2005 Disasters in Numbers
Sapir et al., (2004). Thirty Years of Natural Disasters 1974-2003: The Numbers. Centre for Research on the Epidemiology of Disasters.
Sapir et al., (2004). Thirty Years of Natural Disasters 1974-2003: The Numbers. Centre for Research on the Epidemiology of Disasters.
UN International Strategy for Disaster Reduction (2006). 2005 Disasters in Numbers
Sapir et al., (2004). Thirty Years of Natural Disasters 1974-2003: The Numbers. Centre for Research on the Epidemiology of Disasters.
Abramovitz, JN (2001). Unnatural Disasters. Worldwatch Institute.
Hurricane Katrina: • $125 billion • 1833 lives lost Hazards & Vulnerabilty Research Institute (2006). 2005 U.S. Hazard Losses. University of South Carolina.
Sapir et al., (2004). Thirty Years of Natural Disasters 1974-2003: The Numbers. Centre for Research on the Epidemiology of Disasters.
Natural and Human-Induced Extreme Events • Extreme events, whether natural or human-induced, can cause significant environmental change, not to mention their devastating impacts on peoples’ lives • In 2005, there was an 18% rise in disasters that killed 91 900 people • There were 360 natural disasters in 2005 compared to 305 in 2004: the number of floods increased by 57% in 2005 and droughts by about 47% • The 2004 Indian Ocean tsunami accounted for 92%, and the 2005 South Asian earthquake, for 81% of the deaths in each respective year Sources: CRED 2006: UN/ISDR 2006
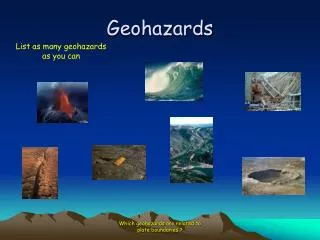
Volcanoes • About 550 volcanoes have erupted in the Earth’s recorded history and an equivalent number of dormant volcanoes have only erupted in the past 10 000 years • On any given day, about ten volcanoes are actively erupting • Explosive eruptions give little warning, while effusive eruptions, which send out gently flowing lava, allow time for people to escape Sources: Camp 2000; Francis 1993; NGDC 2004
Mapping volcanic risk in Africa In this example, high population densities are also associated with areas with active volcanic activity
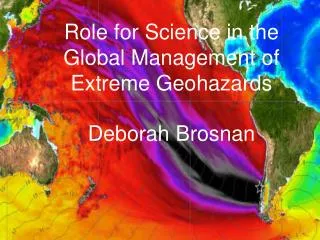
Earthquakes and Tsunamis • According to long-term records (since about 1900), we can expect about 18 major earthquakes (7.0 - 7.9 on the Richter scale) and one great earthquake (8.0 or above) in any given year • The number of earthquakes and tsunamis resulting in fatalities has increased approximately in proportion to global populations • The growth of giant urban cities near regions of known seismic hazard is a new experiment for life on the Earth • Tsunamis are a threat to life and property for all coastal residents Sources: NEIC 2003; USGS 2004; UNEP 2005 (GEO 2004/2005)
Mapping seismic risk in Africa In this example, high population densities are also associated with areas with active seismic activity
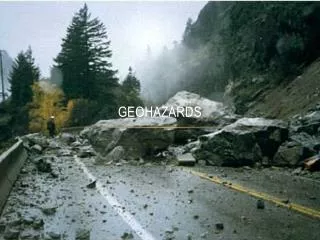
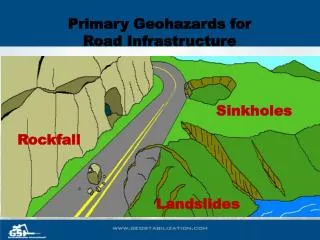
Landslides and Mudslides • Worldwide, thousands of people die every year from landslides and mudslides • In the United Sates alone, they cause an estimated US$1 billion in damage and kill 25 to 50 people every year • Earthquakes, volcanoes, and a number of types of weather events can trigger landslides, which are characterized by lethal mixtures of water, rocks, and mud • The two largest landslides in the world in the 20th century occurred at Mount St. Helens, Washington, in 1980 and at Usoy, Tajikistan, in 1911 • The deadliest landslide in the 20th century was also the result of an earthquake, which occurred in western Iran on 20 June 1990. It caused 40 000–50 000 deaths Sources: NEIC 2003; UNEP 2005 (GEO 2004/2005)
Avalanche wiped out the city of Yungay 1970: Earthquake wipes out Yungay, claims 18,000 lives
Floods • Worldwide, the number of major flood disasters has grown significantly, from 6 cases in the 1950s to 26 in the 1990s • From 1971 to 1995, floods affected more than 1 500 million people worldwide • In the most calamitous storm surge, a flood in Bangladesh in April 1991 killed at least 138 000 people and left 10 million homeless Sources: UN-ISDR 2004; DFO 2004; Wikipedia 2006
Mozambique under water 2000: Due to severe flooding, half a million people were made homeless and 700 lost their lives 22 August 1999: Mozambique under normal conditions 1 March 2000: Mozambique under water
Hurricanes and Cyclones • Scientists predict that global warming will cause warmer ocean temperatures and associated increased moisture in the atmosphere - two variables that work to power hurricanes. As a result, more intense hurricanes that can cause even more damage when they hit land are predicted • Large parts of densely populated coastal areas are subject to the inundation caused by hurricane storm surges; on numerous occasions, they have experienced heavy economic losses from these events Sources: Henderson-Sellers et al. 1998
Drought • A drought is a period of dryness, especially when prolonged, causing extensive damage to crops or preventing their successful growth • Climate change will potentially increase the likelihood of droughts in dry and semi-arid regions. There is already evidence that a number of such regions have experienced declines in rainfall • Throughout history, various parts of the globe have suffered drought and subsequent famine, resulting in huge humanitarian and economic losses Sources: Wikipedia 2006; UNEP 2005
Drop in water level: Lake Mead Drought in the Western United States 2000 2004 PhotoView 18 meters Hoover Dam and Lake Mead
Golf courses along Lake Mead New Golf Courses since 2001
Technological & Intentional Hazards • 123 plants in 24 States where a chemical release of dangerous materials could threaten more than one million people. (U.S. Environmental Protection Agency, 2004) • 15,000 high-risk chemical facilities proximate to tens of millions of citizens
Global Background Context • “There has been a rapid escalation in the incidence of severe disaster events in recent decades. • Total reported global costs have risen 15-fold over the past five decades, • While numbers of people affected tripled between the 1970s and 1990s.” (ProVention Consortium, “Measuring Mitigation,” 2004) • No Light At The End of The Tunnel – Here or Abroad
National Science and Technology Council, 1996on Natural Hazards “Future prospects are sobering. • Continued U.S. population growth, • Increased urbanization and concentration in hazard-prone coastal areas, • Increased capital and physical plant, • Accelerated deterioration of the urban infrastructure, and • Emerging but unknown new vulnerabilities posed by technological advance • Virtually guarantee that economic losses from natural hazards will continue to rise throughout the early part of the coming century. • Losses of $100 billion from individual events, and perhaps unprecedented loss of life, loom in our future.”
Underlying Problems in 1994/1995And Now • We Build in Floodplains • We Destroy Wetlands • We Build Along Earthquake Faults • We Build On The Coast • We Build On Alluvial Fans (spilling from mountains) • We Build In and Near Forests Susceptible to Wildfires • We Try To Control Nature • We Don’t Zone, Code, Build, Maintain (Aging Infrastructure), Inspect and Enforce Appropriately Enough • Thus – Disasters Are A Growth Business