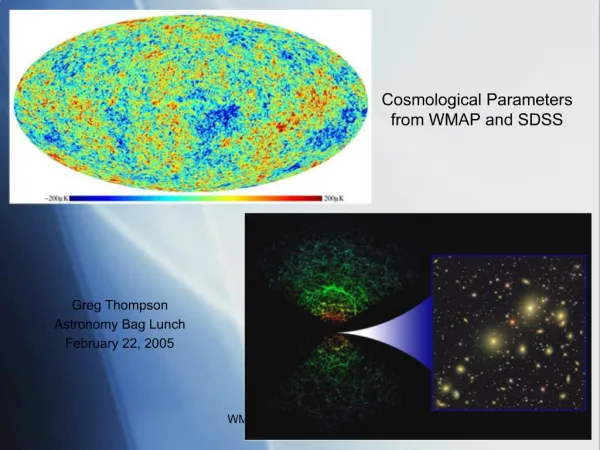
Download
1 / 19
190 likes | 334 Views
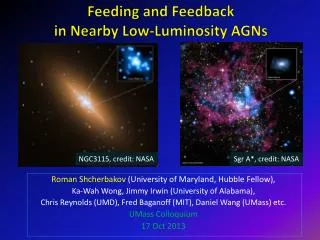
CFA Lunch Talk: November, 14, 2002. The Population and Luminosity Function of AGNs from SDSS. Lei Hao Collaborators : Michael Strauss SDSS collaboration Princeton University. Introduction: AGN emission lines. Broad-line AGNs. Narrow-line AGNs. Veilleux & Osterbrock (1987).

E N D
CFA Lunch Talk: November, 14, 2002 The Population and Luminosity Function of AGNs from SDSS Lei Hao Collaborators: Michael Strauss SDSS collaboration Princeton University
Introduction: AGN emission lines Broad-line AGNs Narrow-line AGNs Veilleux & Osterbrock (1987) Star-forming galaxies
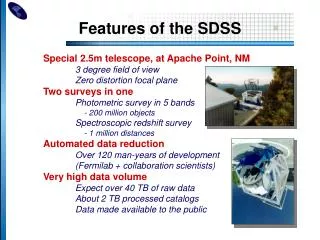
Introduction:Sloan Digital Sky Survey • AGNs are interesting but rare • SDSS is very promising in having a large AGN sample: • one-quarter of the sky • collect spectra of ~ 106 galaxies, 105 quasars, … • Galaxies: r<17.77 • Quasars: i<19.0; color selection • Spectra resolution: ~ 2000 • Over 400,000 spectra have been taken.
Data Sample • 114,772 galaxy and quasar spectra in 1151 sq degrees • 58,038 low redshift (z<0.33) emission line galaxies. • AGNs are identified by their emission line characteristics.
Stellar Subtraction • Emission lines are very easy to be contaminated by the underlying absorption lines. • Apply Principle Component Analysis (PCA) to pure absorption line galaxies. • Use Eigenspectra as stellar templates. • Plus an A star spectrum; Power-law continuum
Stellar Subtraction • The emission lines of AGN are often contaminated by the host galaxy absorption lines. • To correct the contamination,the underlying stellar absorption spectrum is removed from the original spectrum.
Distinguishing AGNs from star-forming galaxies AGN Selections • Broad Line AGNs – FWHM(Hα)>1,200 km/s – 3069 are identified • Narrow Line AGNs Theoretical separation lines predicted by Kewley et.al 2001 Theoretical separation lines predicted by Kewley et.al 2001
AGN Selections • Broad Line AGNs – FWHM(Hα)>1,200 km/s – 3069 are identified • Narrow Line AGNs – 3456 are identified • Seyferts: Galaxy targeted for spectra in SDSS • Quasars: Quasar targeted for spectra in SDSS
The Redshift and Magnitude Distribution • Seyfert sample • r-band Petrosian <17.77 • 1281 broad line AGNs • 2696 narrow line AGNs
The Luminosity Function (LF) of Seyferts • We measure the luminosity function as a function of Hα luminosity. • Assumption • The luminosity of the nuclei is independent of the luminosity of its host galaxy. • We measure the detection probability function for each AGN. Nucleus Spectrum Host galaxy Weakened nucleus Noise New Spectrum AGN?
Luminosity Function Result and Check • Divide the AGN sample into subgroups by their redshifts. • For each group, evaluate the expected AGN luminosity distribution using the LF calculated. • If LF is correct, the expected distribution should match the observed distribution.
Luminosity Function Result and Check • Divide the AGN sample into subgroups by their host galaxy magnitudes. • No systematic discrepancy the nuclei luminosity is not strongly correlated with its host galaxy luminosity.
Host galaxy luminosity vs. Nuclear luminosity • Galaxy Magnitude vs. Hα Luminosity plot 0.01<z<0.03 0.03<z<0.06 0.06<z<0.09 0.09<z<0.12 0.12<z<0.14 0.14<z<0.2 0.12<z<0.14
Host galaxy luminosity vs. Nuclear luminosity • Galaxy Magnitude vs. Hα Luminosity plot • Correlation test (Kendall’s -statistic) study to check the independency. • L(host) ~ L(nuclei) • L(host) ~ L(nuclei) (0.0062±0.0005) • The principal quantity that determines the AGN luminosity is the Eddington ratio, not the black hole mass.
Summary and Future Work • From SDSS, we compiled an AGN sample including over 3000 broad-line AGNs and over 3000 narrow-line AGNs • The LF of the AGNs are calculated and carefully checked. • Nuclear luminosity is independent to the host galaxy luminosity. • Future work: • Seyfert LF normalization and low redshift quasar LF • AGN LF evolution • The connection btw. AGNs and host galaxies • The accretion rate of AGNs
Sersic Index • Animation