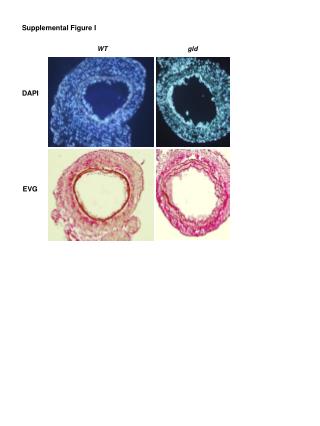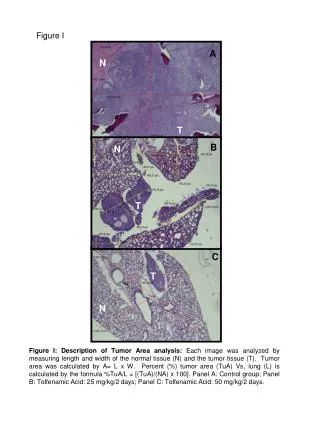
Figure I.
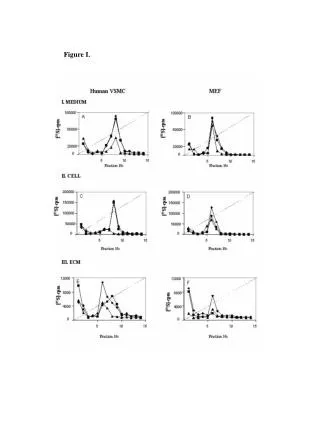
Figure I. + D-4F Sc D-4F. FPLC FXN 29 33 34 35 36 29 33 34 35 36. STOKES DIAMETER nm 17 12.2 10.4 8.2 7.1. 30K. HDL PEAK. HDL PEAK. C C P. C C P. Figure II. W. a. t. e. r. C. o. n. t. r. o. l. +. D. -. 4. F. [. n. m. ]. Second dimension. 9.
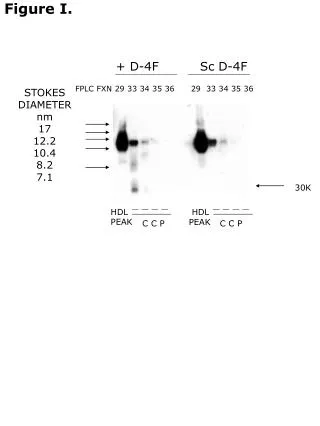

Figure I.
E N D
Presentation Transcript
Figure I. + D-4F Sc D-4F FPLC FXN 29 33 34 35 36 29 33 34 35 36 STOKES DIAMETER nm 17 12.2 10.4 8.2 7.1 30K HDL PEAK HDL PEAK C C P C C P
Figure II. W a t e r C o n t r o l + D - 4 F [ n m ] Second dimension 9 . 5 8 . 2 7 . 1 Pre-beta HDL Pre-beta HDL F i r s t d i m e n s i o n
Figure III. 40.0 35.0 30.0 40.0 Sc D-4F 25.0 + D-4F 35.0 CHOLESTEROL CHOLESTEROL PON ACTIVITY 20.0 20.0 PON ACTIVITY 20.0 30.0 15.0 25.0 CHOLESTEROL, mgr / DL CHOLESTEROL, mgr / DL PON ACTIVITY, U/ mL PON ACTIVITY, U/ mL 20.0 10.0 10.0 10.0 15.0 5.0 10.0 0.0 0.0 0.0 5.0 20 30 40 20 30 40 0.0 FRACTION # FRACTION #
Figure IV. 16 14 14 12 12 MIGRATED MONOCYTES PER FIELD 10 10 P=0.01 8 8 P=0.01 6 6 4 4 No LDL LDL LDL LDL LDL 2 2 Addition + + + + + D 4F CCP - Chow Control CCP 0 0 hHDL Chow Control HDL LDL D 4F HDL - Control Assay Controls 50 µg HDL Cholesterol 10 µg CCP Cholesterol
Figure V. P<0.01 35 30 % Cholesterol Efflux from Macrophages 25 20 15 10 0.1% BSA Control human HDL D-4F Sc D-4F 5 0 Murine HDL, 50 mg
Figure VI. A B C 2.5 14 16 2.0 VLDL/IDL LDL HDL 12 14 1.5 LOOH Per Cholesterol Sc - D - 4F 12 10 * * 1.0 10 Sc Sc Sc - - - D D D - - - 4F 4F 4F D - 4F 8 0.5 8 6 0 * 6 4 4 2 2 0 0 6.0 Chow Chow D -4F Chow 4.5 D E 3.0 6.0 FPLC Fractions after Pre-beta HDL HDL Pre- Beta * 1.5 D - 4F Sc 4F LOOH Per Cholesterol D - D - 4F 4.5 0 3.0 1.5 0.00 0.00 0.00 0 Chow D - 4F Chow
70 Figure VII. * 60 50 40 30 PON units 20 10 0 Water Control Sc D-4F D-4F
Figure VIII. Scrambled D-4F D-4F Second dimension Pre-beta Pre-beta alpha-HDL alpha-HDL First Dimension
Figure IX. W a t e r C o n t r o l + D - 4 F [ n m ] 8 . 2 Second dimension 7 . 1 Pre-beta HDL Pre-beta HDL F i r s t d i m e n s i o n
Figure X. 1250 1000 HDL 750 500 * ng LOOH per well Pre-Beta HDL 250 * 0 Control, Chow D-4F Control, Chow D-4F