

E N D
Presentation Transcript
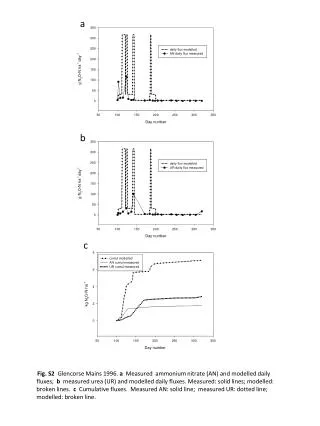
a b c Fig. S2Glencorse Mains 1996. a Measured ammonium nitrate (AN) and modelled daily fluxes; b measured urea (UR) and modelled daily fluxes. Measured: solid lines; modelled: broken lines. c Cumulative fluxes. Measured AN: solid line; measured UR: dotted line; modelled: broken line.
a b d c e Fig. S3 Glencorse Mains, 1997. a, b MeasuredAN and modelled daily fluxes, linear and log scales, respectively; c, d measured UR and modelled daily fluxes, linear and log scales, respectively. Measured: solid lines; modelled: broken lines. e Cumulative fluxes. Measured AN: solid line; measured UR: dotted line; modelled: broken line.
a b c Fig. S4Glencorse Mains 1999. a, b Measured AN and modelled daily fluxes, linear and log scales, respectively; Measured: solid lines; modelled: broken lines. c Cumulative fluxes. Measured AN: solid line; modelled: broken line.
a b c Fig. S5 Glencorse Mains 2001. a,bMeasured AN and modelled daily fluxes, linear and log scales, respectively. Measured: solid lines; modelled: broken lines. c Cumulative fluxes. AN measured: solid line; modelled: broken line.
a b c d e Fig. S6 North Berwick area 1998. a, b Measured AN and modelled daily fluxes, linear and log scales, respectively; c, d measured UR and modelled daily fluxes, linear and log scales, respectively. Measured: solid lines; modelled: broken lines. e Cumulative fluxes. Measured AN: solid line; measured UR: dotted line; modelled: broken line.
a b c d e Fig. S7 Auchincruive 1997. a, b MeasuredAN and modelled daily fluxes, linear and log scales, respectively; c, d measured UR and modelled daily fluxes, linear and log scales, respectively. Measured: solid lines; modelled: broken lines. e Cumulative fluxes. Measured AN: solid line; measured UR: dotted line; modelled: broken line.
a b c Fig. S8 Crichton 1996. a, b Measured daily fluxes , AN and UR, respectively. Each graph shows actual measurements (solid lines) and modelled values (broken lines), and also the putative emission patterns if emissions had been near-zero between days 138 and 156 (dot-and-dash lines; see text). c Cumulative fluxes, based on these putative emission patterns: AN : solid line; UR: dotted line; modelled: broken line.
a b c Fig. S9 ADAS Bridgets, 1999. a, b Measured AN and modelled daily fluxes, linear and log scales, respectively. Measured: solid lines; modelled: broken lines. c Cumulative fluxes. Measured AN: solid line; modelled: broken line.
a b c Fig. S10 North Wyke, 1999. a, b MeasuredAN and modelled daily fluxes, linear and log scales, respectively. Measured: solid lines; modelled: broken lines. c Cumulative fluxes. Measured AN: solid line; modelled: broken line.
a b c Fig. S11 Sutton Bonington, 2001. a, b Measured AN and modelled daily fluxes, linear and log scales, respectively. Measured: solid lines; modelled: broken lines . c Cumulative fluxes. Measured AN: solid line; modelled: broken line.
a b c Fig. S12 Grange-over-Sands, 2000. a, b Measured AN and modelled daily fluxes, linear and log scales, respectively. Measured: solid lines; modelled: broken lines. c Cumulative fluxes. Measured AN: solid line; modelled: broken line.
a b Fig. S13 a Modelled seasonal N2O emissions versus seasonal measured emissions from ammonium nitrate (AN)-fertilized sites, with regression and confidence limits. Data (solid triangles) relate to site-seasons from which training data were obtained for determination of thresholds and Nmintrend. Slope of regression line not significantly different from that in Fig 10 (p = 0.065). b Corresponding plot for all site-seasons (excluding Aberystwyth outlier), whether used for training data (triangles) or only for modelling (circles); regression line for the combined data: Y=1.031X + 3.529; R2 = 0.674, p<0.001.
a b c Fig. S14 a Modelled seasonal EFs versus measured seasonal EFs from ammonium nitrate (AN)-fertilized sites. Points used for regression (solid circles) relate to all site-seasons, except those from which training data were obtained for determination of thresholds and Nmintrend, and one outlier (Aberystwyth), together with regression line and confidence limits. Open circle: outlier. b Corresponding plot (solid triangles) for site-seasons providing “training data”, together with regression line and confidence limits. c Corresponding plot for all site-seasons (excluding Aberystwyth outlier), whether used for training data (triangles) or only for modelling (circles); regression line for the combined data: Y = 0.812X + 1.681; R2 = 0.403, p<0.05.