Download
1 / 24
240 likes | 426 Views
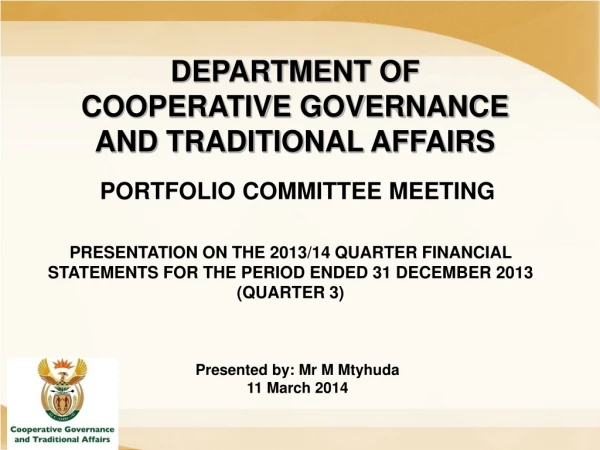
DEPARTMENT OF COOPERATIVE GOVERNANCE AND TRADITIONAL AFFAIRS. PORTFOLIO COMMITTEE ON COOPERATIVE GOVERNANCE AND TRADITIONAL AFFAIRS STATE OF EXPENDITURE FOR THE 2013/14 FINANCIAL YEAR AS AT 31 DECEMBER 2013. Presented: Mr M Mtyhuda 11 March 2014. OVERVIEW OF THE PRESENTATION. Purpose

E N D
DEPARTMENT OF COOPERATIVE GOVERNANCE AND TRADITIONAL AFFAIRS PORTFOLIO COMMITTEE ON COOPERATIVE GOVERNANCE AND TRADITIONAL AFFAIRS STATE OF EXPENDITURE FOR THE 2013/14 FINANCIAL YEAR AS AT 31 DECEMBER 2013 Presented: Mr M Mtyhuda 11 March 2014
OVERVIEW OF THE PRESENTATION • Purpose • Expenditure analysis as at 31 December 2013
PURPOSE The purpose of the presentation is to present to the Portfolio Committee: • The state of expenditure as at 31 December 2013 (3rd Quarter) for the 2013/14 financial year.
EXPENDITURE ANALYSIS AS AT 31 DECEMBER 2013 (Cont.) OVERALL EXPENDITURE: The total expenditure of the Department amounts to R39.743 million at the end of December 2013. This amount represents a 68.0 per cent spending rate of the total appropriation of the 2013/14 financial year. Programme 1: Administration R’000 Adjusted Budget for 2013/14 FY: R219 871 Actual expenditure (31 December): R157 680 Variance R 62 191 (71.7 per cent) The Programme reflected a 71.7 per cent spending at the end of December 2013, and the key cost drivers within Programme 1 are the following: • External Audits. • Operating Leases • Property Payments
EXPENDITURE ANALYSIS AS AT 31 DECEMBER 2013 (Cont.) Programme 2: Policy, Research and Knowledge Management R’000 Adjusted Budget for 2013/14 FY: R 52 492 Actual expenditure (31 December): R 32 174 Variance R 20 318 (61.3 per cent) PRKM demonstrated a 61.3 per cent spending rate at the end of December 2013. The main reason for low spending was due to the delays with the migration from Novell to Microsoft and the renewal of SITA license that are paid in February each year.
EXPENDITURE ANALYSIS AS AT 31 DECEMBER 2013 (Cont.) Programme 3: Governance & Intergovernmental Relations R’000 Adjusted Budget for 2013/14 FY: R 40 722 949 Actual expenditure/transfers (31 December): R 28 611 950 Variance R 12 110 999 (70.3 per cent) The Programme reflected a 70.3 per cent spending rate at the end of December 2013. The available amount of R12 billion at the end of December 2013 mainly relate to the Local Government Equitable Share for payment to the municipalities in line with the Division of Revenue Act, 2013 (Act 2 of 2013) (DORA) requirements. The main reason for low spending was due to: • The delays with the start of some planned projects as a result of consultations with different stakeholders; and • The offsetting of the LGES in terms of Section 21(4) of DORA in respect of some municipalities in consultation with the National Treasury, which may result in a saving on transfer payments funds allocated to this Programme.
EXPENDITURE ANALYSIS AS AT 31 DECEMBER 2013 (Cont.) Programme 4: National Disaster Management Centre R’000 Adjusted Budget for 2013/14 FY: R 705 396 Actual expenditure/transfers (31 December): R 189 650 Variance R 515 746 (26.9 per cent) The Programme reflected a 26.9 per cent spending rate at the end of December 2013. R488 million (94.6 per cent) of the available amount of R516 million at the end of December 2013 relate to the Disaster Relief and Municipal Disaster Recovery Grants. The main reason for low spending was due to: • The finalisation of the movement to the new premises and the effect thereof on related services; and • The uncertain nature of the Disasters.
EXPENDITURE ANALYSIS AS AT 31 DECEMBER 2013 (Cont.) Programme 5 Provincial & Municipal Government Systems R’000 Adjusted Budget for 2013/14 FY: R 281 627 Actual expenditure (31 December): R 272 204 Variance R 9 423 (96.7 per cent) The Programme indicated a 96.7 per cent spending rate at the end of December 2013. The main reason for the higher expenditure related to the acceleration of the completion of existing projects and new priority projects that have been identified for the remainder of the 2013/14 financial year for which virements of funds have been agreed to.
EXPENDITURE ANALYSIS AS AT 31 DECEMBER 2013 (Cont.) • Programme 6: Infrastructure and Economic Development • R’000 • Adjusted Budget for 2013/14 FY: R16 371 416 • Actual expenditure (31 December): R10 399 523 • Variance R 5 971 893 (63.5 per cent) The Programme reflected a 63.5 per cent spending rate at the end of December 2013. R5 287 billion (88.8 per cent) of the available amount of R5 971 billion at the end of December 2013 relate to the Municipal Infrastructure Grant. The main reason for low spending by this Programme was due to delays in the start of some of the planned projects and the scheduling of the payment of the outstanding funds for the Municipal Infrastructure Grant during March 2014.
EXPENDITURE ANALYSIS AS AT 31 DECEMBER 2013 (Cont.) Programme 6.1: Community Work Programme R’000 Adjusted Budget for 2013/14 FY: R1 731 326 Actual expenditure (31 December): R1 159 403 Variance R 571 923 (67 per cent) The Community Work Programme reflected a 67 per cent spending rate at the end of December 2013. The Unit received roll-over funds, which is planned to be spend in February and March 2014. The key cost drivers within CWP are the following: • Wage costs • Material Cost • Project Management and Administration costs The main reason for the low spending by this Programme was due to the municipal sites that were established later in the 2013/14 financial year.
EXPENDITURE ANALYSIS AS AT 31 DECEMBER 2013 (Cont.) • Programme 6.2: Municipal Infrastructure Support Agency (MISA) • R’000 Adjusted Budget for 2013/14 FY: R 262 040 • Actual expenditure/transfer (31 December): R 156 667 • Variance R 105 373 (59.8 per cent) 59.8 per cent of the available funds were paid to and in respect of MISA up to the end of December 2013. The main reason for the slow spending is the progressive operationalisation of MISA, to function independently as a government component.
EXPENDITURE ANALYSIS AS AT 31 DECEMBER 2013 (Cont.) • Programme 7: Traditional Affairs • R’000 • Adjusted Budget for 2013/14 FY: R 105 156 • Actual expenditure (31 December): R 80 105 • Variance R 25 051 (76.2 per cent) DTA reflects a 76.2 per cent spending rate at the end of December 2013. The higher spending rate relate to the increased need for traditional affairs involvement at all levels of government.
EXPENDITURE ANALYSIS AS AT 31 DECEMBER 2013 (Economic Classification)
EXPENDITURE ANALYSIS AS AT 31 DECEMBER 2013 (Cont.) COMPENSATION OF EMPLOYEES: R’000 Adjusted Budget for 2013/14 FY: R 313 182 Actual expenditure (31 December): R 217 990 Variance R 93 192 (70.1 per cent) The compensation of employee expenditure reflected a 70.1 per cent spending rate at the end of December 2013. The main reason for the lower spending rate is the delays experienced with the finalisation of the performance assessments for senior Managers, filling of priority posts and staff turnover.
EXPENDITURE ANALYSIS AS AT 31 DECEMBER 2013 (Cont.) GOODS AND SERVICES: R’000 Adjusted Budget for 2013/14 FY: R 2 166 671 Actual expenditure (31 December): R 1 429 648 Variance R 737 023 (66.0 per cent) Goods and services reflected a 66 per cent spending rate at the end of December 2013 and relates mainly to the following areas: • The Community Work Programme reflected a 67 per cent spending rate at the end of December 2013. The Unit received roll-over funds, which is scheduled to be spent during February and March 2014; • MISA reflected a 59.8 per cent spending/transfer rate at the end of December 2013. The lower spending is mainly due to the progressive operationalisation of MISA to function independently as a government component; and • Delays with the start of some planned projects. The Department has implemented actions to fast track spending on these projects up to the end of the 2013/14 financial year, as far as possible.
EXPENDITURE ANALYSIS AS AT 31 DECEMBER 2013 (Cont.) PAYMENTS OF CAPITAL ASSETS: R’000 Adjusted Budget for 2013/14 FY: R 10 595 Actual expenditure (31 December): R 5 467 Variance R 5 128 (51.6 per cent) Payments of capital assets demonstrated a 51.6 per cent spending rate at the end of December 2013. The main cost drivers under this economic classification for the remainder of the 2013/14 financial year relate to: • The movement of the National Disaster Management Centre to appropriate office space and the related costs for office equipment and furniture; and • The payment of the new servers as part of the upgrading and improvement of Information Communication and Technology services in the Department.
EXPENDITURE ANALYSIS AS AT 31 DECEMBER 2013 (Cont.) TRANSFERS AND SUBSIDIES: R’000 Adjusted Budget for 2013/14 FY: R 55 954 559 Actual expenditure/transferred (31 December): R 38 102 724 Variance R 17 851 835 (68.1per cent) The Department is projecting that all funds allocated for the Public Entities and Grants to municipalities will be transferred by the end of March 2014, in line with the approved payment schedules. Underspending is projected on the Disaster Relief Grant and the Local Government Equitable Share mainly due to the uncertainty of disaster events and the offsetting of the Local Government Equitable Share, in line with the DORA regulations.