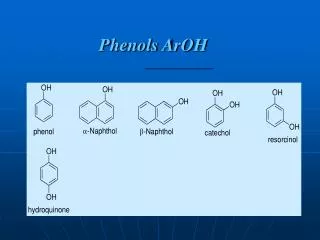
Holistic Calibration of Passive Sampling for Alkylated Phenols: PASSIMPACT Project Insights
This project focuses on the calibration of passive sampling devices to monitor alkylated phenols (APs) and their environmental impacts, funded by the Norwegian Research Council. The PASSIMPACT initiative investigates the occurrence and effects of endocrine disruptors like octylphenol and nonylphenol in Norwegian waters, affected by offshore discharges and oil spills. Through a series of lab and field trials, we establish kinetic factors and validate calibration results, contributing to more effective monitoring of produced water discharges.

Holistic Calibration of Passive Sampling for Alkylated Phenols: PASSIMPACT Project Insights
E N D
Presentation Transcript
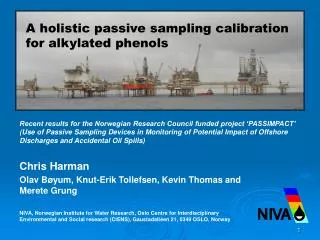
A holistic passive sampling calibration for alkylated phenols Recent results for the Norwegian Research Council funded project ‘PASSIMPACT’ (Use of Passive Sampling Devices in Monitoring of Potential Impact of Offshore Discharges and Accidental Oil Spills) Chris Harman Olav Bøyum, Knut-Erik Tollefsen, Kevin Thomas and Merete Grung NIVA, Norwegian Institute for Water Research, Oslo Centre for Interdisciplinary Environmental and Social research (CIENS), Gaustadalléen 21, 0349 OSLO, Norway
Norwegian Basin (The Norwegian Petroleum Directorate, 2005)
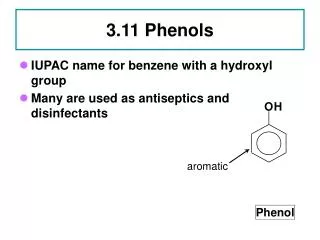
Background • Endocrine disrupting effects of octylphenol (OP), nonylphenol (NP) and some nonylphenol ethoxylates (A9PEO) • Domestic and industrial cleaning agents but also wide ranging industrial applications • European production of NP is around 4.5 x 10⁴ tons y-1 • Mainly discharged though wastewater treatment plants • Use of APEO in production chemicals offshore phased out in the Norwegian sector of the North Sea • However AP are naturally occurring in crude oils • Readily found in operational discharges e.g. produced water • Discharge of PW predicted to peak at 2.5 x 10⁸ m3 • Low mg L-1 levels in produced waters, decreasing concentration with increasing chain length
Alkylphenols – documented effects in fish • Acutely toxic • Endocrine disruptors • Bind to estrogen receptors • Estrogenic in males • Interfere with steroid production/metabolism • Interfere with steroid transport • Inhibits gonad development • Cause intersex • Ecological effects uncertain Tollefsen et al. Submitted to Ecotoxicol. Environ. Saf.
AP calibration as part of PASSIMPACT • WP1 : Uptake studies of passive samplers and monitoring organisms • Suite of laboratory exposures using a range of passive sampling techniques. Establishment of relevant kinetic factors under different, controlled conditions, including membrane fouling. • WP2 : WAF experiments • Same exposure systems as WP1, but using the water accommadated fraction (WAF) of a crude oil with a high content of unresolved complex mixture (UCM). • WP3 : Field trial • Field verification of calibration results by passive sampling the receiving waters of a Norwegian production platform. • WP4 : Data and concept evaluation • Evaluation of the data from the first 3 work packages against existing risk assessment models such as DREAM.
Exposure set up • Simple flow through system • Both hydrophobic (SPMD) and hydrophilic (POCIS-Pharms) sampling devices exposed to a mix of hydrocarbons commonly found in PW e.g. • PAHs • 30 APs • Carbazoles • 100 ng/L for 4 weeks, samplers removed every week • Biofouling more extensive than expected • losses to biodegradation/ sorption
Calibration – analysis and data treatment • Analysis by (underivitised) GC-MS • Avoids splitting samples • Results corrected for blanks and procedural recovery • Quantification by the use of surrogate ISTD • Curves fitted directly to the data using the overall uptake equation • Rs (L d-1) values estimated from the initial linear part of these uptake curves or
Results – SPMDs group 1 • C0-C2 • Phenol, o/m/p cresol, 2,4/2,5/3,5-dimethyl and 4-ethyl • Log Kow 1.5-2,6 • At Log Kow < ~3there is no quantifiable uptake by SPMDs (as expected) • Blank problems and analytical difficulties for some compounds.
Results – SPMDs group 2 • C3-C4 • Log Kow ~ 3-3.5 • Equilibrium attained early t1/2 within a few days – one week • Time integrative period therefore short • Rs 20-70mL d-1 • Compounds not well suited to sampling with SPMDs?
Results – SPMDs group 3 • C5-C7 • Log Kow ~ 3.5-5.0 • Curvlinear - approaching equilibrium • Rs 100-1000 mL d-1 • Typically several hundred ng/SPMD after 4 weeks • Suited to sampling with SPMDs • Straight chained APs not included
Results – SPMDs Group 4 • C8-C9 • Log Kow ~ >5.0 • Curvlinear stage but equilibrium not approached • Time integrative period longer • Rs 0.5-6 L d-1 • Highly suited to sampling with SPMDs • 4-n-Octyl/Nonyl not included
Results – SPMDs ’group 5’ (straight chained alkylphenols)
Group 5 • Fitting uptake equation to 0-14 day data, overestimated sampling rates. • Rs estimated from linear 0-7 days curve. • Pentylphenol – group 2, Heptyl/ Octyl/ Nonyl – group 4 • Increasing relative degradation/ sorption with increasing chain length
Dissipation of Performance Reference Compounds (PRCs) • All SPMDs spiked with PRCs • Dissipation modelled by • Allows adjustment of laboratory and field data by, for example Release of Chrysene D12 Phenanthrene D10 Flourene D10 and Acenaphthene D10
POCIS results - examples R2 0.99 R2 0.99 R2 0.97 R2 0.99
Results POCIS • Curves fitted by using the linear equation and Rs calculated from the slope • C0-C1 unfortunately (highest concentration in PW) not quantifiable • C2-C6 (Log Kow ~ 2-4) sampling rates typically 100-600 mL d-1 • >C6 no quantitative uptake in POCIS • Intercept - hydrophobicity • Higher blank values than SPMDs for some compounds (sampling rate for 2,6-Di-tert-butylphenol 34 L d-1!) *Poor standard response
AP calibration – summary and conclusions • Useful sampling rates for compounds with log kow 2.5-6.0 (C2-C9) • Ranging from 0.1-6L d-1 • Both POCIS and SPMDs are required to cover the full range of APs • Further modelling will describe the relationship between physicochemical properties and uptake • Uptake by SPMDs can be estimated for other APs • More difficult for POCIS as interactions with the sorbent are varied • Also comparison of different PRC correction methods • Ongoing work will examine the effects of fouling on the uptake • Experiment has been repeated under different conditions – confirmation of modelling • Allows calculation of time integrated water concentrations for 25 alkylphenols
Acknowledgments • Funding • The Norwegian Research Council (NFR) • Technical assistance • Olav Bøyum, NIVA • Marine research Station – Solbergstrand, Norway • Support with PSDs • CERC, USGS – Dave Alvarez and Jim Huckins • University of Portsmouth, UK – Graham Mills