Download
1 / 26
260 likes | 396 Views
The Real Cost of Inadequate Patient Access Processes. Presented by: Tim Raimey Date: October 31, 2012. Who is Beacon Partners?. One of the largest healthcare consulting firms in North America.

E N D
The Real Cost of Inadequate Patient Access Processes Presented by: Tim Raimey Date: October 31, 2012
Who is Beacon Partners? • One of the largest healthcare consulting firms in North America. • We develop strategies and deliver services that support the latest industry trends such as ICD-10 strategy, Meaningful Use, EHR implementations, ACO readiness, HIE planning, physician-hospital alignment and much more. • We’re focused on helping healthcare leaders improve operational, clinical and financial performance, ultimately leading to increased patient safety and better outcomes.
Why are claims denied? Many claims are denied due to inadequate patient registration processes
Common Registration Errors • Missing Social Security Numbers • Incomplete or Missing Guarantor Information • Incomplete or Missing Employer Information • Policy Identification number incorrect
Common Reasons for Denials • Patient not eligible • Charges are not covered in the plan • No authorization or no precertification on file • Wrong payer identified • Benefit reached maximum allowable under plan
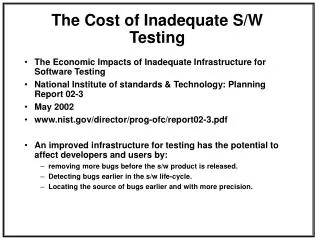
Cost to Rework a Claim: Physician • Assumptions: • Staff Time includes 20 minutes of billing staff time at $22 per hour, plus 10 minutes of another staff member’s time(ex: front office) valued at $20 per hour • Supplies include telephone, paper, envelope postage • Interest is calculated on $200 at 10%, compounded monthly for 30 days • Overhead includes management, equipment, space and other fixed costs Source: Walker, Woodcock, Larch, 2009
Cost to Rework a Claim: Hospital • Assumptions: • Staff Time includes 30 minutes of billing staff time at $24 per hour, plus 10 minutes of at least another staff member’s time(ex: front office) valued at $20 per hour • Suppliesinclude telephone, paper, envelope postage • Overheadincludes management, equipment, space and other fixed costs for hospital Source: HFMA Executive Roundtable, Nov 2010 Zimmerman and Associates 2009
Pulmonary and Sleep Study Practice • Pulmonary and Sleep Study Practice with offices in 4 locations: • Five providers seeing an average of 80 patients per day collectively • Sleep studies account for about 45 of the 80 patients per day • Sleep studies tend to be costly
Claims Payment • Pulmonary services for this practice typically have a 95% success rate with claims paid • Sleep study services average 78% success rate with claims paid • Front desk staff minimally experienced • Claims denied for sleep study are very costly to the patient, provider, and provider staff
Looking at the Real Costs A closer look at the costs of a denied sleep study claim: Office visit $1,550, plus $1,500 for medical equipment and supplies = $3,050 • $3,050 x 10 patients(22% x 45 patients) =$30,500 • Add 40 minutes of the provider’s time explaining to an angry patient about the claim
Ophthalmology Practice Ophthalmology practice, one provider: • Averages 15 patients per day • Patients tend to be older population • Success rate for claims paid in this practice 95% • Experienced front desk staff
Looking at the Real Cost Office visit for new patient, Level IV $225 A closer look at the Ophthalmology Practice: • Provider sees 15 patients per day for 4 days a week total 60 patients • On average 3 patients per week claims are denied (5% x 60) Weekly average loss in claims(3 patients x $225) =$675 or($2,700 per month)
Opportunity Costs But dig a bit deeper….. • Add 2 to 3 hours of the front desk staff’s time investigating the reason claim denied • Add 1 hour to the provider’s time explaining the denial to his elderly patients • Add the potential of write offs • Add the potential of “he’s a good doc, don’t worrying about paying”
Hospital in the Midwest General Hospital in Midwest with 340 beds • Emergency Department (ED) capable of providing services for all levels of care, including critical • ED averages 65 patients per day • Patients are billed for ED services based on categories of care provided • Category 1 (lowest) to Critical Care (highest)
Looking at the Real Costs A closer look at the costs: Category 3 charge is $441(majority of patients) • This hospital reports the success rate for claims paid for ED charges is about 75% Assuming 25% of 65 patients can’t or won’t pay, loss would be(16 patients x $441) =$7,056 per day
Additional Time and Effort Let’s look even deeper…. • $7,056 per day x 7 days = $49,392 a week • $49,392 x 4 weeks = $197,568 a month • Add in the hours the billing staff spend with insurance companies, patients, and medical records staff
What’s the goal? • Reduceclaimsdenial • Increasecash flow • Improve patientexperience • Decrease bad debt • Reduce provider and staff time spent on discussions about why claims denied
How do we get there? • Adequately train front desk staff to get registration right the first time • Assign enough staff for registration activities • It’s better to capture the data right the first time, than to spend time investigating what was missed • Use integrated systems to assist staff in registration and verification • Pre-register as many patients as possible
How do we get there? (continued) • Pre-verify insurance eligibility, authorizations, pre-certifications • Audit registration outcomes and processes • Track denials by payer, reason, financial impact • Communicate denial rates back to front end staff • Collect copayments • Collect self pay
Leading Performance Indicators • Error rates due to front end billing: • < 2% • Time of service collections: • Copayments: 100% • All other time of servicepayments:75% • Number of patients cleared prior to visit: • 90 % • Claim edits and denials due to registration and referrals: • < 2% • Percentage of insurance verified: • 98% Source: Walker-Keegan, Woodcock, Larch, 2009
Leading Claims Submissions Rates • Clean claim submission rate – 90% • Medicare return to provider denial rate – 3% • Bad debt write off as a % of gross income – 3% • Charity write off as a % of gross income – 2% • Overall final denial rate after appeals – 1% Source: 2010 HIMSS Financial Systems Steering Committee
Healthcare Reform Impact If all of these processes are being addressed, then you will have one less challenge as your organization moves toward achieving Meaningful Use and preparing for ICD-10 implementation.
Thank You For more information please contact: traimey@beaconpartners.com