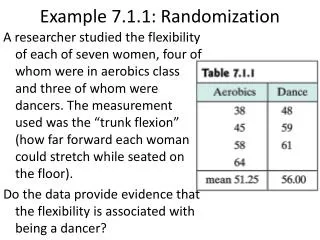
Example 7.1.1: Randomization
Example 7.1.1: Randomization. A researcher studied the flexibility of each of seven women, four of whom were in aerobics class and three of whom were dancers. The measurement used was the “trunk flexion” (how far forward each woman could stretch while seated on the floor).

Example 7.1.1: Randomization
E N D
Presentation Transcript
Example 7.1.1: Randomization A researcher studied the flexibility of each of seven women, four of whom were in aerobics class and three of whom were dancers. The measurement used was the “trunk flexion” (how far forward each woman could stretch while seated on the floor). Do the data provide evidence that the flexibility is associated with being a dancer?
Hypothesis testing: Questions Categorical (Chapter 9) Is the success probability = ½? Is the success probability = p? Normal Distribution Is the population mean = 50? Is the population mean = 0 Normal Distribution: 2 populations Do the two populations have the same mean? Is the difference of the two population means = d?
Procedure (1/4) • State the scientific question to be answered. Use complete sentences, no symbols (optional on Homework) • Define the parameters of interest. (e.g., m1, m2and what each refers to.) • State the H0 and HA hypothesis mathematically (in terms of parameters) H0: usually ‘=‘, HA: usually ‘<‘, ‘>’, ‘’ • State the significance level a. If not stated explicitly, a = 0.05
Procedure (2/4) 5. Calculate the test statistic from the data. test statistic: t, F, WMW also include all additional parameters necessary, like df 6. Calculate the rejection region by finding the critical value using the distribution the test statistic follows under H0. If required calculate the P-value. This (with ) defines the rejection region
Procedure (3/4) 7. Compare the test statistic to the rejection region or compare the P-value to a. Is the test statistics ≤ or ≥ the critical value? Is the P-value ≤ 8. Make a decision about the null hypothesis: • If the test statistic is in the rejection region, or the p-value is smaller than a, state “reject the null hypothesis” • If not, state “do not reject the null hypothesis” Never use the word ‘accept’.
Procedure (4/4) 9. Form a scientific conclusion based on that decision. If 8a) then start with “This study provides evidence…” If 8b) then start with “This study does not provide evidence…” Followed by “[(P = x)] at the ___ significance level that “ followed by the verbal statement of the alternative hypothesis. use complete sentences with no symbols (except possibly P) – Don’t be creative!
Example 7.2.1: Toluene and the Brain In an investigation of the mechanism of the toxic effects of toluene in the brain, the concentration of brain NE (norepinephrine) in a toluene-laden atmosphere on the medulla region of rats’ brains, the observed mean NE in the toluene group (mean y1 = 540.8 ng/g) was substantially higher than the mean in the control group(mean y2 = 444.2 ng/g). Is this a real biological effect? What are the null and alternative hypothesis?
Example: Hypotheses Seedlings were germinated under two different lighting conditions. Their lengths (in cm) were measured after a specified time period. The data are as follows: What are H0 and Ha?
Example 7.2.2: Toluene and the Brain In an investigation of the mechanism of the toxic effects of toluene in the brain, the concentration of brain NE (norepinephrine) in a toluene-laden atmosphere on the medulla region of rats’ brains, the observed mean NE in the toluene group (mean y1 = 540.8 ng/g) was substantially higher than the mean in the control group(mean y2 = 444.2 ng/g). Is this a real biologically effect? What is the test statistic?
Example: Test Statistic Seedlings were germinated under two different lighting conditions. Their lengths (in cm) were measured after a specified time period. The data are as follows: What are H0 and Ha? What is the test statistic?
Example: two sample, non directional In a study of the periodical cicada (Magicicadaseptendecim), researchers measured the hind tibia lengths of the shed skins of 100 individuals. Results for males and females are shown below. Assuming that hind tibia lengths follow a normal distribution, compare the mean hind tibia lengths for male and female cicadas using an appropriate hypothesis test.
Example: two sample, non directional (cont) If reject H0: Answer: This study provides evidence (P = 0.0024) at the 0.05 significance level that male and female cicadas have different mean tibia lengths. If fail to reject H0: Answer: This study does not provide evidence (P = 0.24) at the 0.05 significance level that male and female cicadas have different mean tibia lengths.
Example: two sample, directional A pain-killing drug was tested for efficacy in 50 women who were experiencing uterine cramping pain following childbirth. 25 of the women were randomly allocated to receive the drug and the remaining 25 received a placebo. Capsules of the drug or placebo were given before breakfast and again at noon. A pain relieve score, based on hourly questioning through the day, was computed for each woman. The possible pain relief scores ranged from 0 (no relief) to 56 (complete relief for 8 hours). Summary results are shown in the table on the next slide. Assuming that the pain relief scores approximately follow a normal distribution, test for efficacy of the drug at reducing uterine cramping pain.
Example: two sample, directional This study does not provide evidence (P > 0.5) at the 0.05 significance level that the drug is more effective than the placebo at reducing uterine cramping pain
Example 7.6.1: large n Lactate dehydrogenase (LD) is an enzyme that may show elevated activity following damage to the heart muscle or other tissues. A large study of serum LD levels in healthy young people yielded the results shown below.
Example 7.6.2: small n Imagine that we are studying the body weight of men and women, and obtain the realistic (fictitious) data shown below.
Example 7.6.1: (cont) Lactate dehydrogenase (LD) is an enzyme that may show elevated activity following damage to the heart muscle or other tissues. A large study of serum LD levels in healthy young people yielded the results shown below.
Example 7.6.2: (cont) Imagine that we are studying the body weight of men and women, and obtain the realistic (fictitious) data shown below.
Table 5: Number of Observations for Independent-Samples t Test
Table 6: Critical Values of Us Note: Us in bold P-values (non-directional) in italics Directional P-values: divide number by 2
Example: WMW The sage cricket, Cyphooderrisstepitans, mates unusually. During mating the female eats the male’s fleshy hind wings; the wounds are not fatal. The females prefer males that have not already been wounded. The scientific question is: ”Are females more likely to mate if they are hungry?”