Download
1 / 8
90 likes | 216 Views
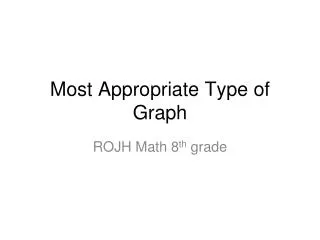
Choosing an Appropriate Graph . Bar graph, Double bar graph, Line graph, Double line graph, Circle graph, Line plot, Histogram, Pictograph. Parts of a Graph. All graphs MUST include: Title Labeled x-axis Labeled y-axis Even spacing Key . Using Appropriate Graphs.

E N D
Choosing an Appropriate Graph Bar graph, Double bar graph, Line graph, Double line graph, Circle graph, Line plot, Histogram, Pictograph
Parts of a Graph • All graphs MUST include: • Title • Labeled x-axis • Labeled y-axis • Even spacing • Key
Using Appropriate Graphs • Making comparisons – bar graph/double bar graph • Change over time – line graph/double line graph • Multiples of a number – pictograph • Parts of a whole – circle graph • Equal intervals – histogram
Examples • Wingspans of these endangered or threatened birds: bobwhite, California condor, Mariana mallard, whooping crane, and Hawaiian hawk. • The number of species of birds sighted, organized in the intervals 0-2, 3-5, 6-8, 9-11, and 12-14. • Marty has kept track of how he has spent his money during the past year. He wants to display the data on a graph. Which type of graph is the best choice?
Which of these would be the best type of graph to display the data below? Dan's day:sleep 8 hrs. school 7 hrs. baseball practice 2 hrs. homework 1 hr. free time 5 hrs. chores 1 hr. A. bar graph B. circle graph C. line graph D. pictograph
The school had a fall cookie sale. At the next PTA meeting they plan to show how much money was raised by each of the 4 grade levels. Which graph would be best for communicating the results? A. bar graph B. double-bar graphs C. line graph D. pictograph
Which of the following is a bar graph of the data from the table? A B C D
Which bar graph displays the same information that is in this table? A B C D